Open Access
Fig. 1.
Download original image
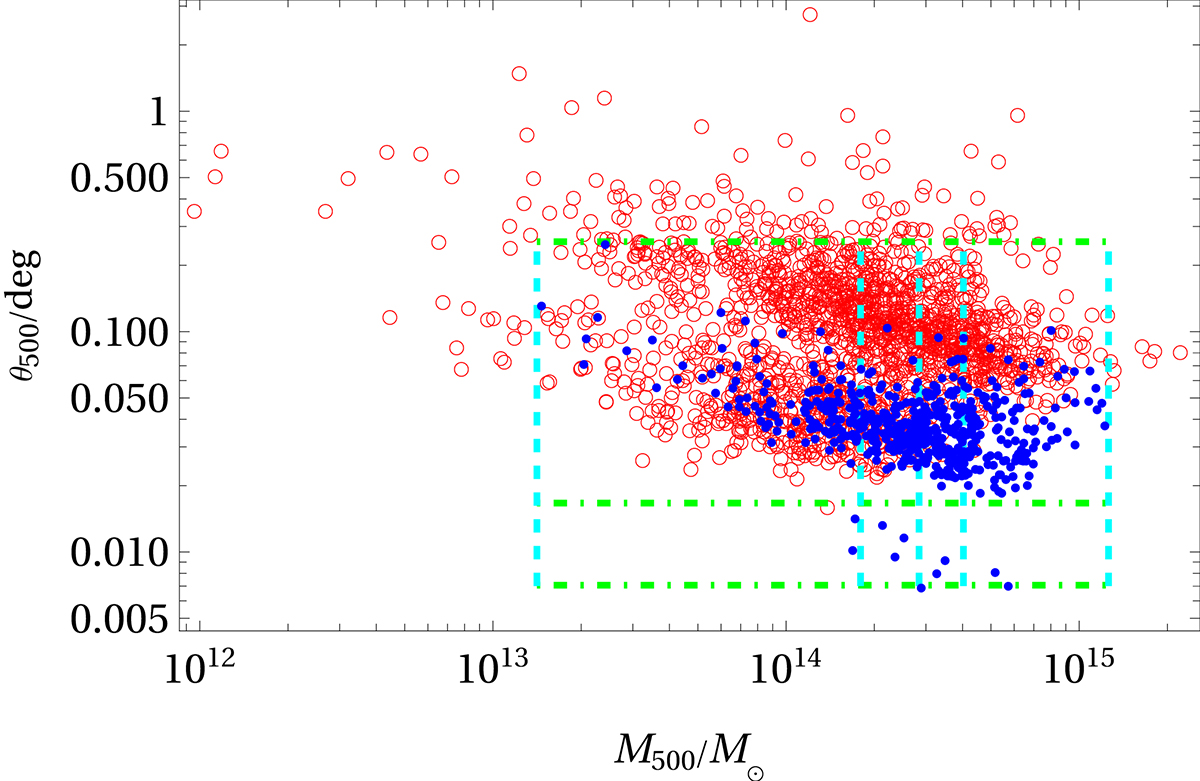
M500–θ500 phase space of eROSITA EDR clusters (blue disks), shown in comparison to MCXC clusters (red circles), with boundaries demarcating the four equal-sized mass bins (vertical dashed lines) and the ten excluded θ500 < 1′ clusters (horizontal dot-dashed lines).
Current usage metrics show cumulative count of Article Views (full-text article views including HTML views, PDF and ePub downloads, according to the available data) and Abstracts Views on Vision4Press platform.
Data correspond to usage on the plateform after 2015. The current usage metrics is available 48-96 hours after online publication and is updated daily on week days.
Initial download of the metrics may take a while.