Fig. 14
Download original image
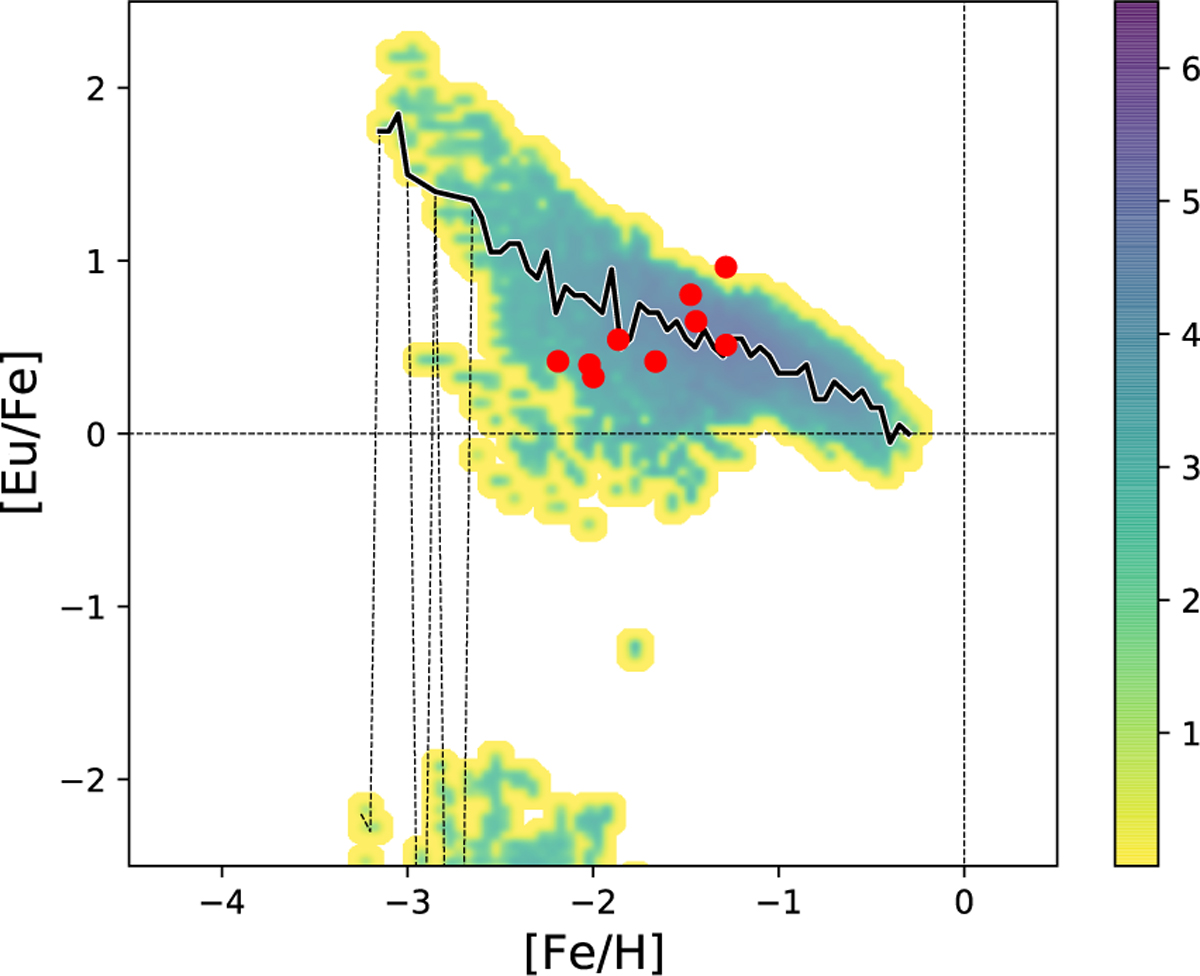
Same as Fig. 13, but for the abundance ratios of [Eu/Fe] versus [Fe/H]. The black line shows the most probable value of the model in [Eu/Fe] at each bin in [Fe/H]. We exclude the abundances with [Eu/Fe] < −2, since these extremely low abundances in europium are hardly measurable. The line obtained including these extreme values is displayed with a tiny dashed line.
Current usage metrics show cumulative count of Article Views (full-text article views including HTML views, PDF and ePub downloads, according to the available data) and Abstracts Views on Vision4Press platform.
Data correspond to usage on the plateform after 2015. The current usage metrics is available 48-96 hours after online publication and is updated daily on week days.
Initial download of the metrics may take a while.