Fig. 12
Download original image
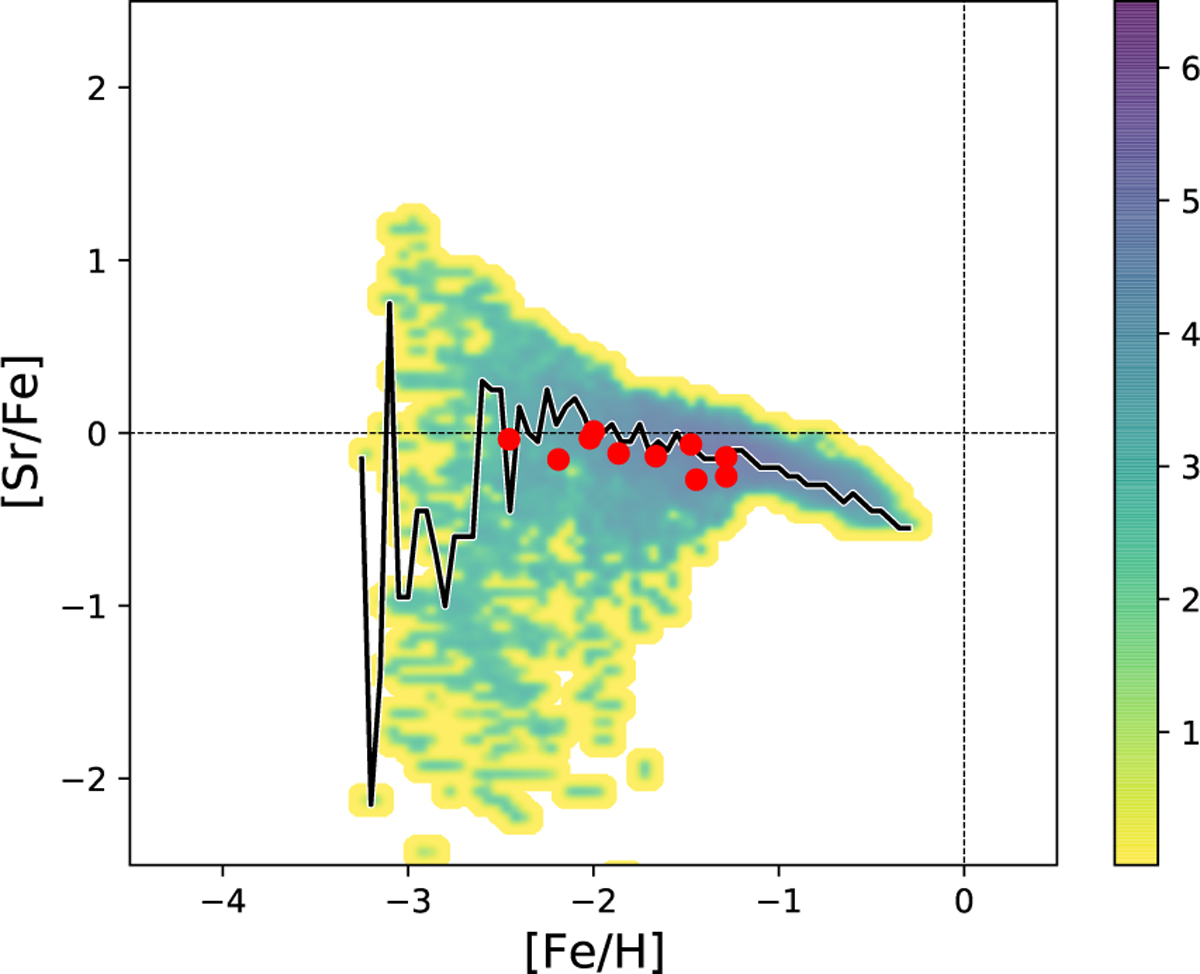
Abundance ratios of [Sr/Fe] versus [Fe/H]. The red dots are the abundances of the GSE stars in our sample; the colour-coded area shows the results of the stochastic model. The colour coding is described in the bar as the number density of long-living stars in log-scale. The black line shows the most probable value of the model in [Sr/Fe] at each bin in [Fe/H].
Current usage metrics show cumulative count of Article Views (full-text article views including HTML views, PDF and ePub downloads, according to the available data) and Abstracts Views on Vision4Press platform.
Data correspond to usage on the plateform after 2015. The current usage metrics is available 48-96 hours after online publication and is updated daily on week days.
Initial download of the metrics may take a while.