Fig. 1
Download original image
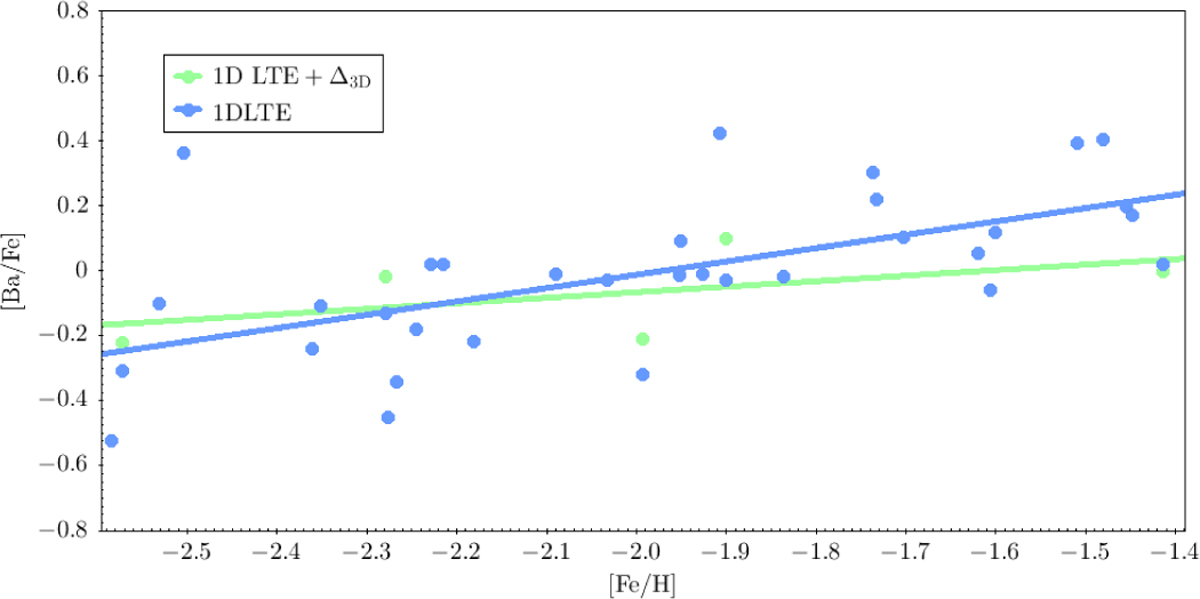
Barium abundance, [Ba/Fe], versus metallicity, [Fe/H]. Blue dots represent the 1D LTE barium abundances derived from the barium line at 5853 Å. Green dots represent the corrected [Ba/Fe] values obtained for a subset of five stars by adding the 3D NLTE corrections (Ba corr(*) − Ba corr(⊙)) given in Table 3 to the 1D LTE [Ba/Fe] abundance. The blue line (resp. green line) is the linear fit to the 1D LTE (3D NLTE) abundances.
Current usage metrics show cumulative count of Article Views (full-text article views including HTML views, PDF and ePub downloads, according to the available data) and Abstracts Views on Vision4Press platform.
Data correspond to usage on the plateform after 2015. The current usage metrics is available 48-96 hours after online publication and is updated daily on week days.
Initial download of the metrics may take a while.