Fig. 9.
Download original image
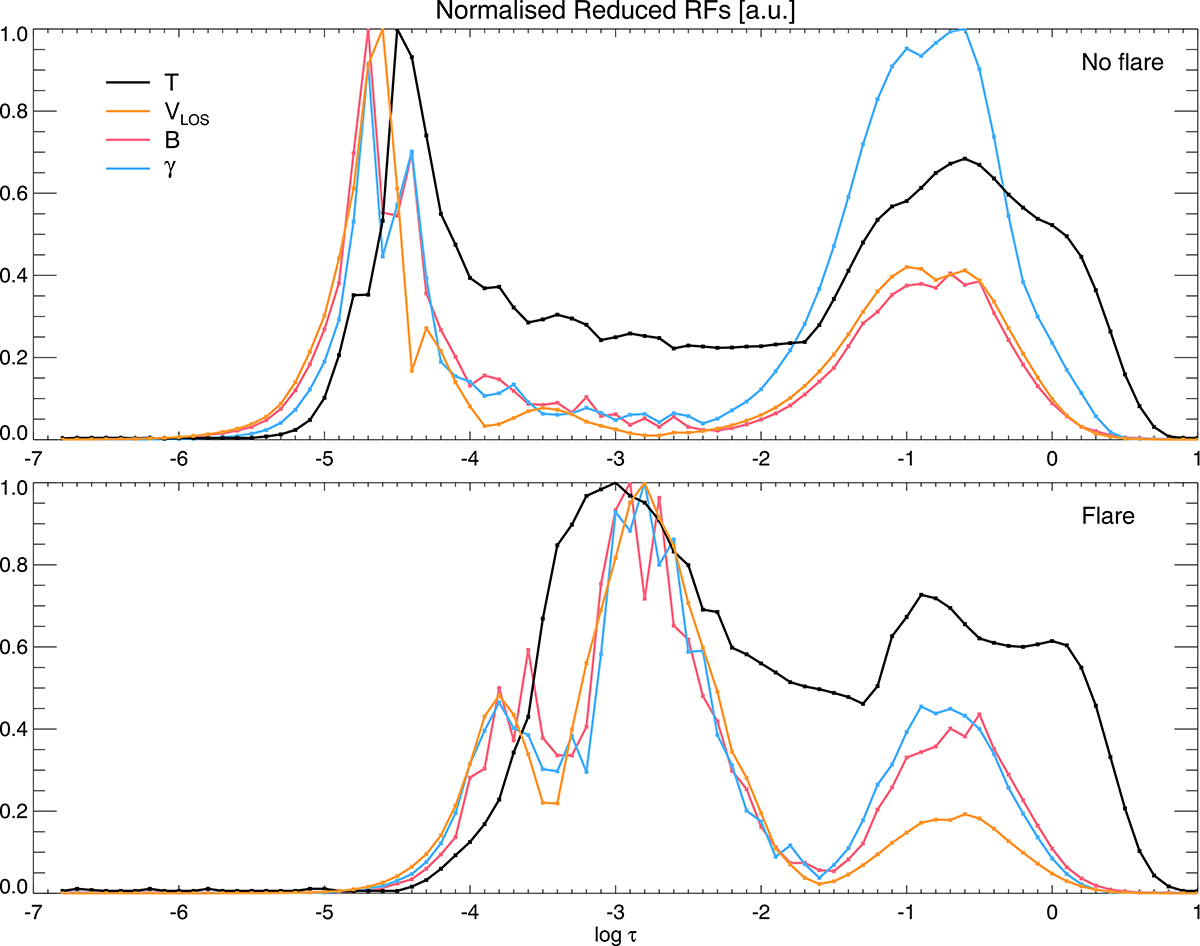
Reduced 1D RFs to display the effective sensitivity of our observation configuration. Each panel shows the 1D RFs for temperature (black), LOS velocity (orange), magnetic field strength (red), and inclination (blue). Each line corresponds to the maximum RF value for the four Stokes parameters and all the wavelengths belonging to the Fe I and Ca II spectral lines. Panels correspond to a pixel located outside the flare ribbon (top) and inside the flare ribbon (bottom).
Current usage metrics show cumulative count of Article Views (full-text article views including HTML views, PDF and ePub downloads, according to the available data) and Abstracts Views on Vision4Press platform.
Data correspond to usage on the plateform after 2015. The current usage metrics is available 48-96 hours after online publication and is updated daily on week days.
Initial download of the metrics may take a while.