Fig. 7.
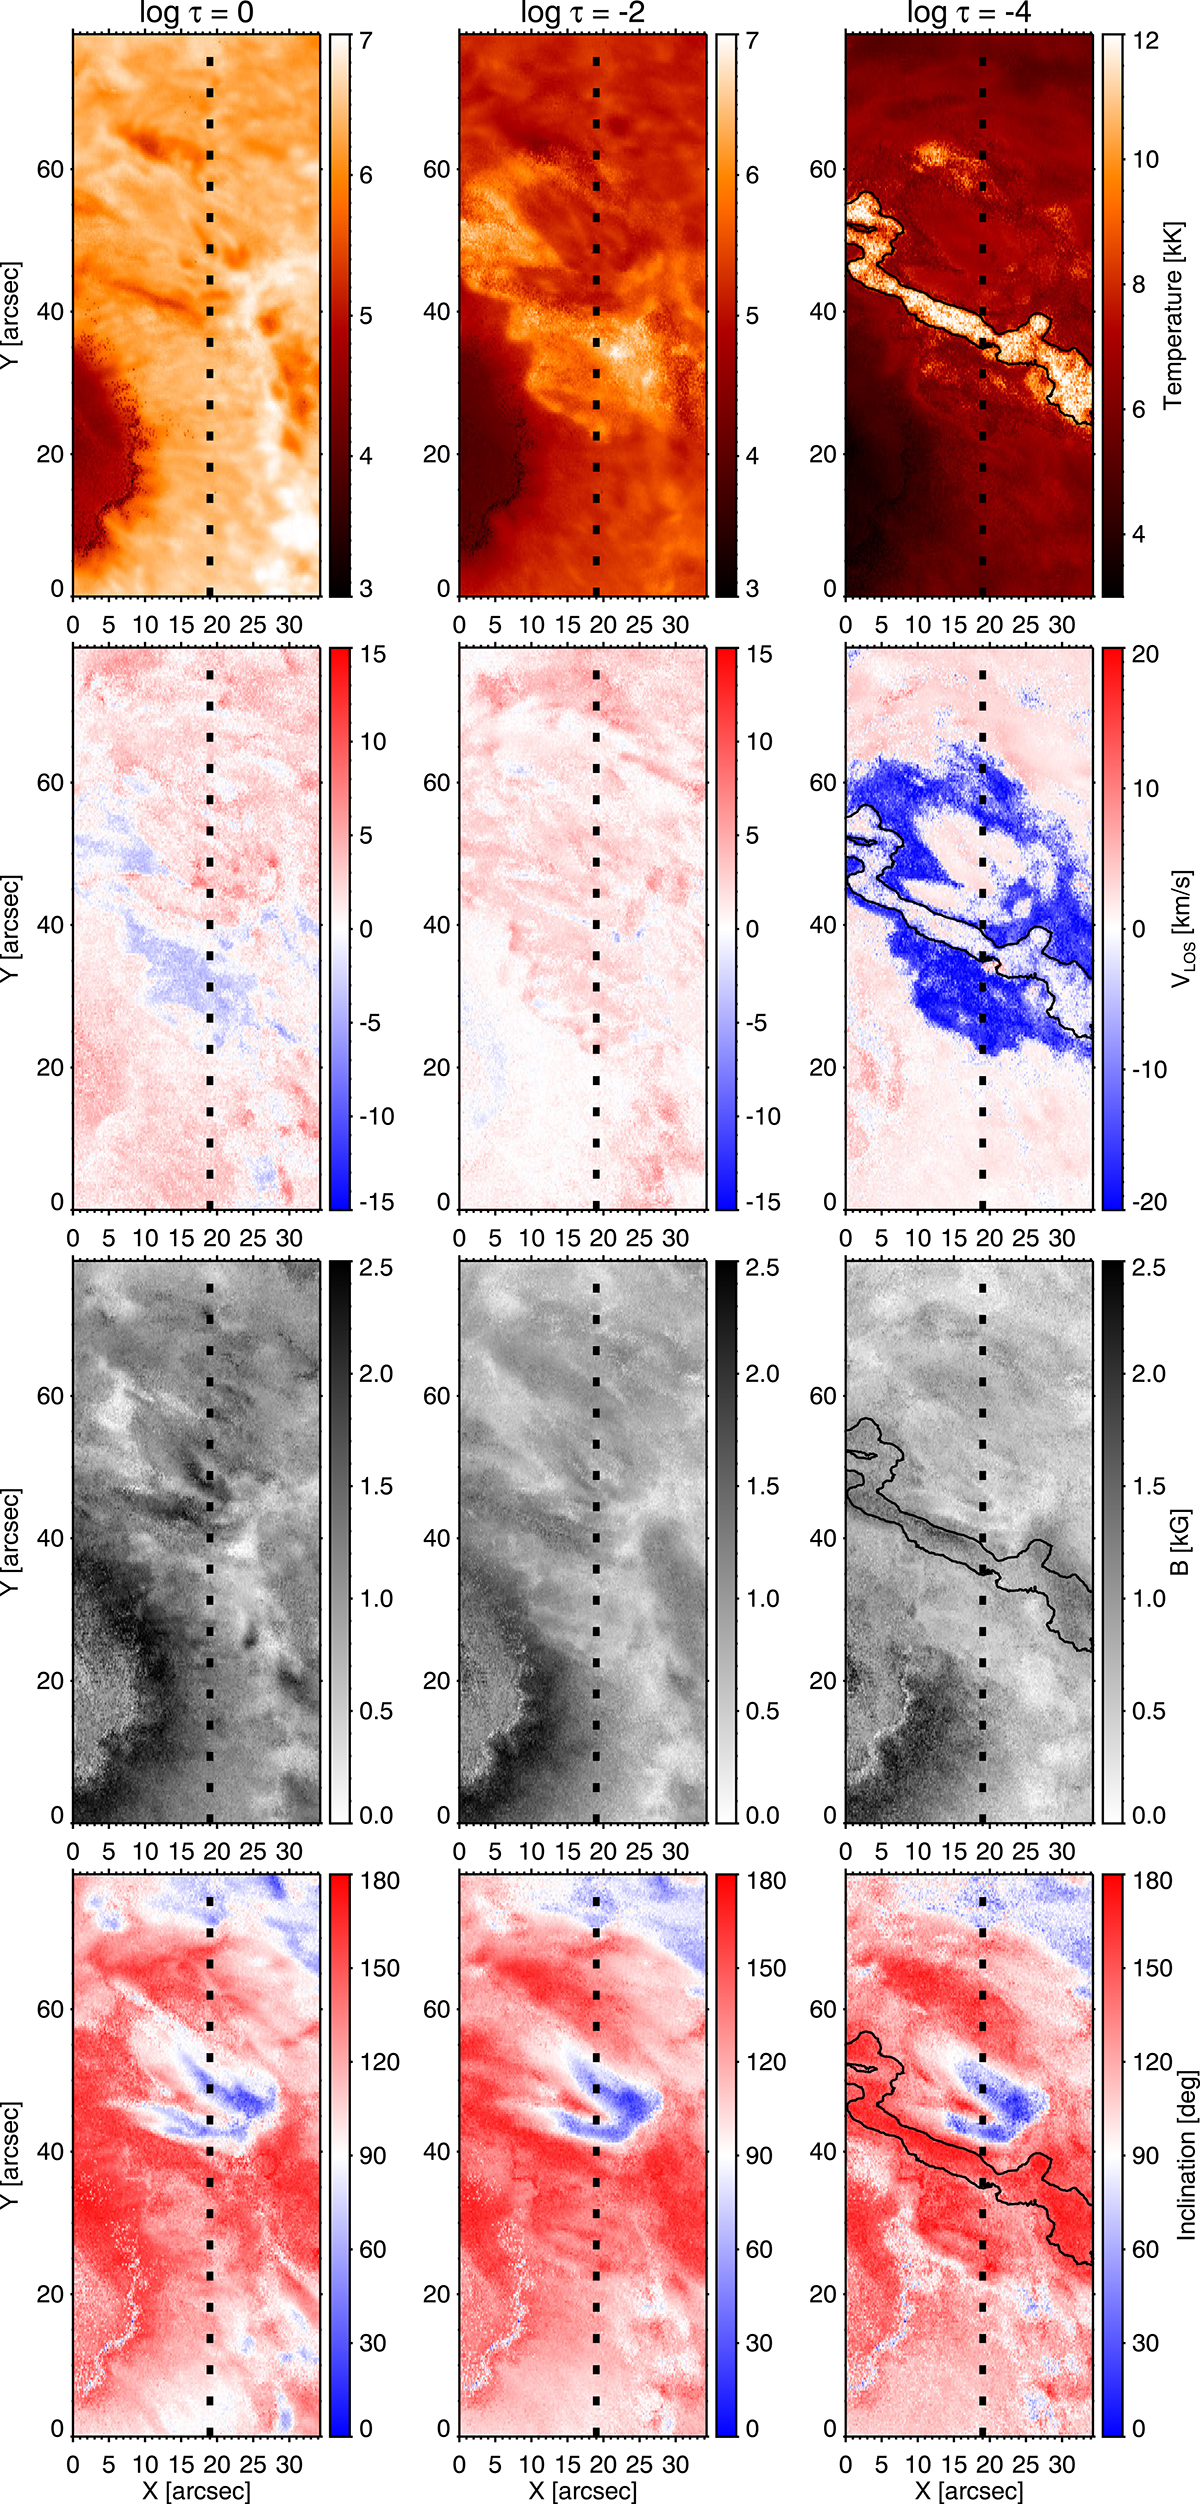
Download original image
Variation with height of the atmospheric parameters across different optical depths in the solar atmosphere. Columns represent three optical depths, from left to right, log τ = [0, −2, −4]. Rows display, from top to bottom, the temperature, LOS velocity, magnetic field strength, and inclination. The dashed line highlights a region crossing the flare ribbon, which we study later. We also added, as a reference, a contour line representing the area of temperature enhancement at log τ = −4 in the panels of the rest of the atmospheric parameters at the same optical depth.
Current usage metrics show cumulative count of Article Views (full-text article views including HTML views, PDF and ePub downloads, according to the available data) and Abstracts Views on Vision4Press platform.
Data correspond to usage on the plateform after 2015. The current usage metrics is available 48-96 hours after online publication and is updated daily on week days.
Initial download of the metrics may take a while.