Fig. 5.
Download original image
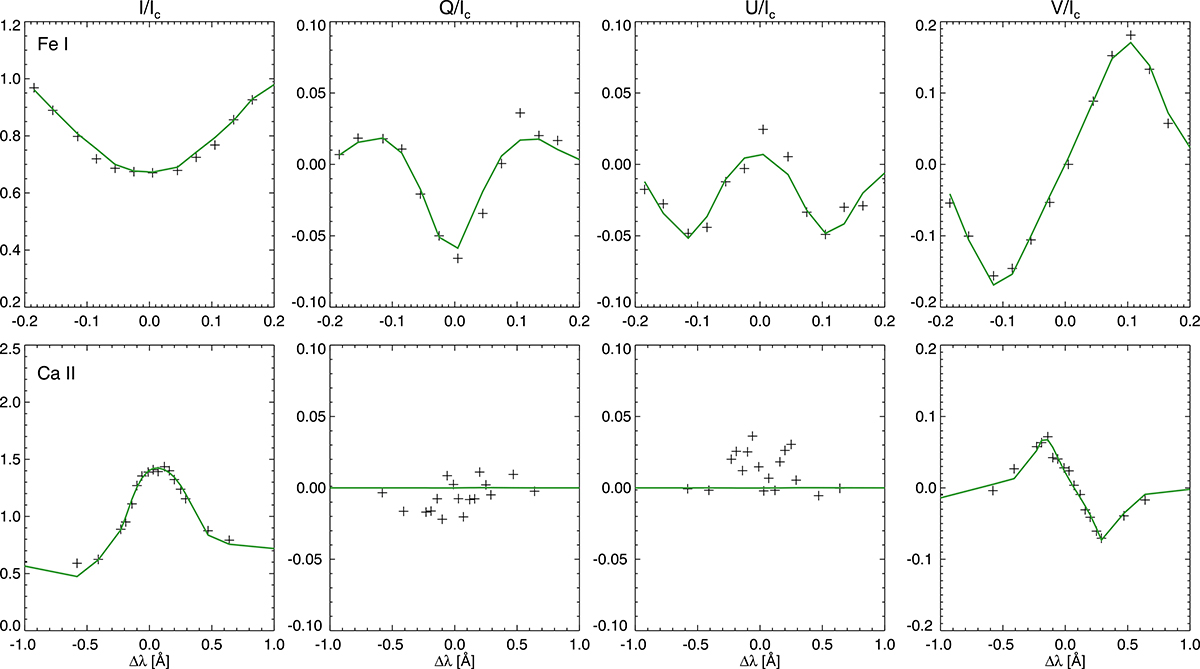
Comparison between the observed and the fitted Stokes profiles. The top and bottom rows show the Stokes profiles for the Fe I and Ca II transitions, respectively. From left to right, we have the Stokes I, Q, U, and V parameters, respectively. Crosses correspond to the observed profiles, while solid coloured lines represent the fit obtained during the inversions. The spatial location of this pixel is highlighted in green in Fig. 4.
Current usage metrics show cumulative count of Article Views (full-text article views including HTML views, PDF and ePub downloads, according to the available data) and Abstracts Views on Vision4Press platform.
Data correspond to usage on the plateform after 2015. The current usage metrics is available 48-96 hours after online publication and is updated daily on week days.
Initial download of the metrics may take a while.