Fig. 4.
Download original image
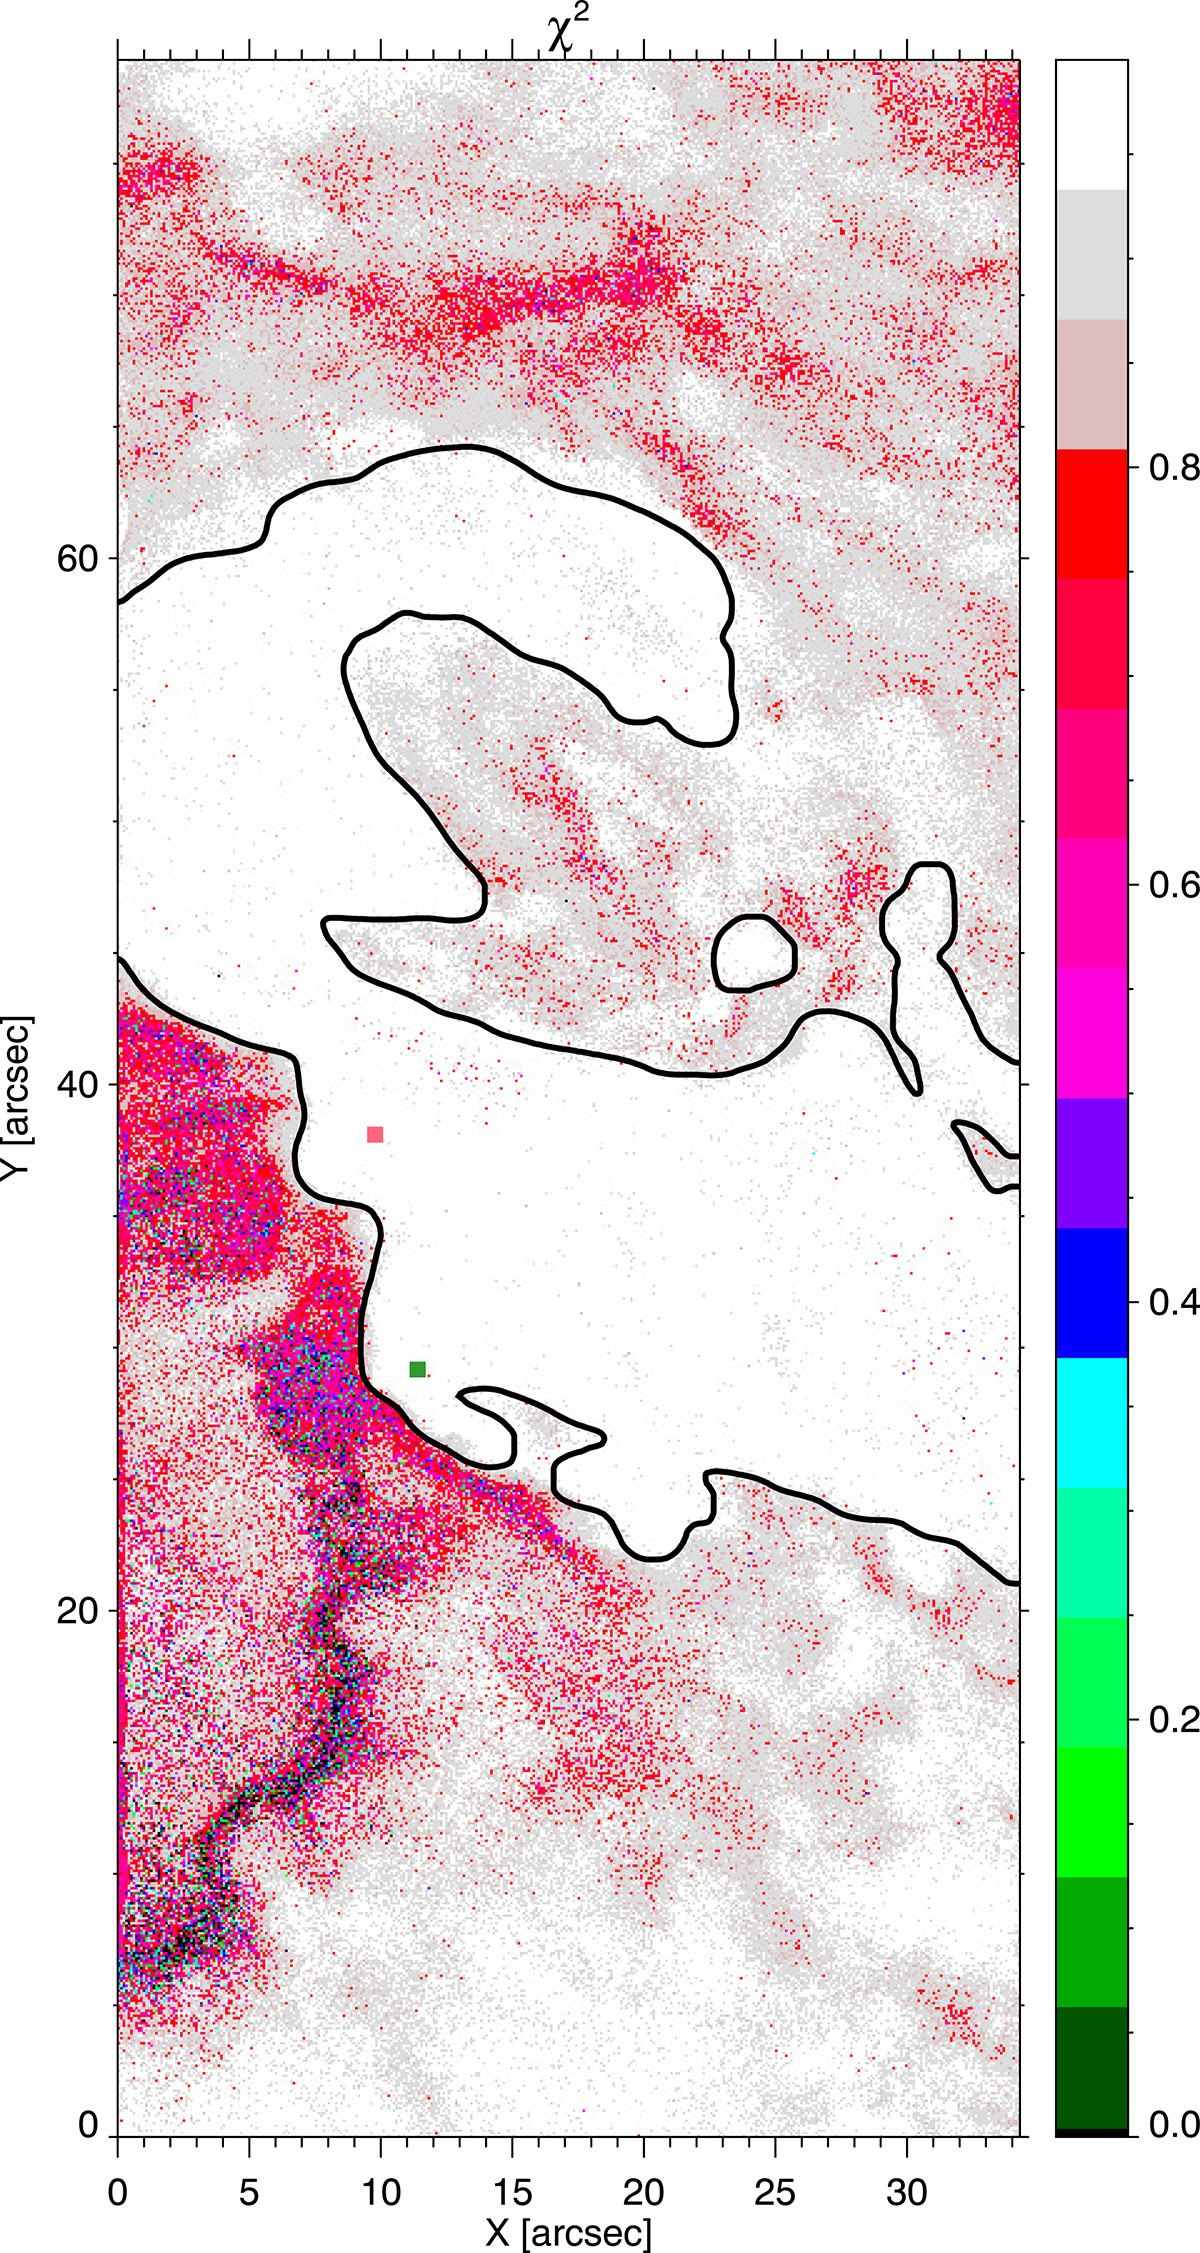
Spatial distribution of the inverse χ2 over the IBIS observed FOV. Values corresponding to one represent a highly accurate fit, while values close to zero correspond to a poor fit. The green and pink squares designate the location of reference pixels we study later. The black contour highlights the location of the flare ribbon, and it corresponds to the areas with enhanced intensity on the line core of the Ca II transition (see Fig. 2).
Current usage metrics show cumulative count of Article Views (full-text article views including HTML views, PDF and ePub downloads, according to the available data) and Abstracts Views on Vision4Press platform.
Data correspond to usage on the plateform after 2015. The current usage metrics is available 48-96 hours after online publication and is updated daily on week days.
Initial download of the metrics may take a while.