Fig. 2.
Download original image
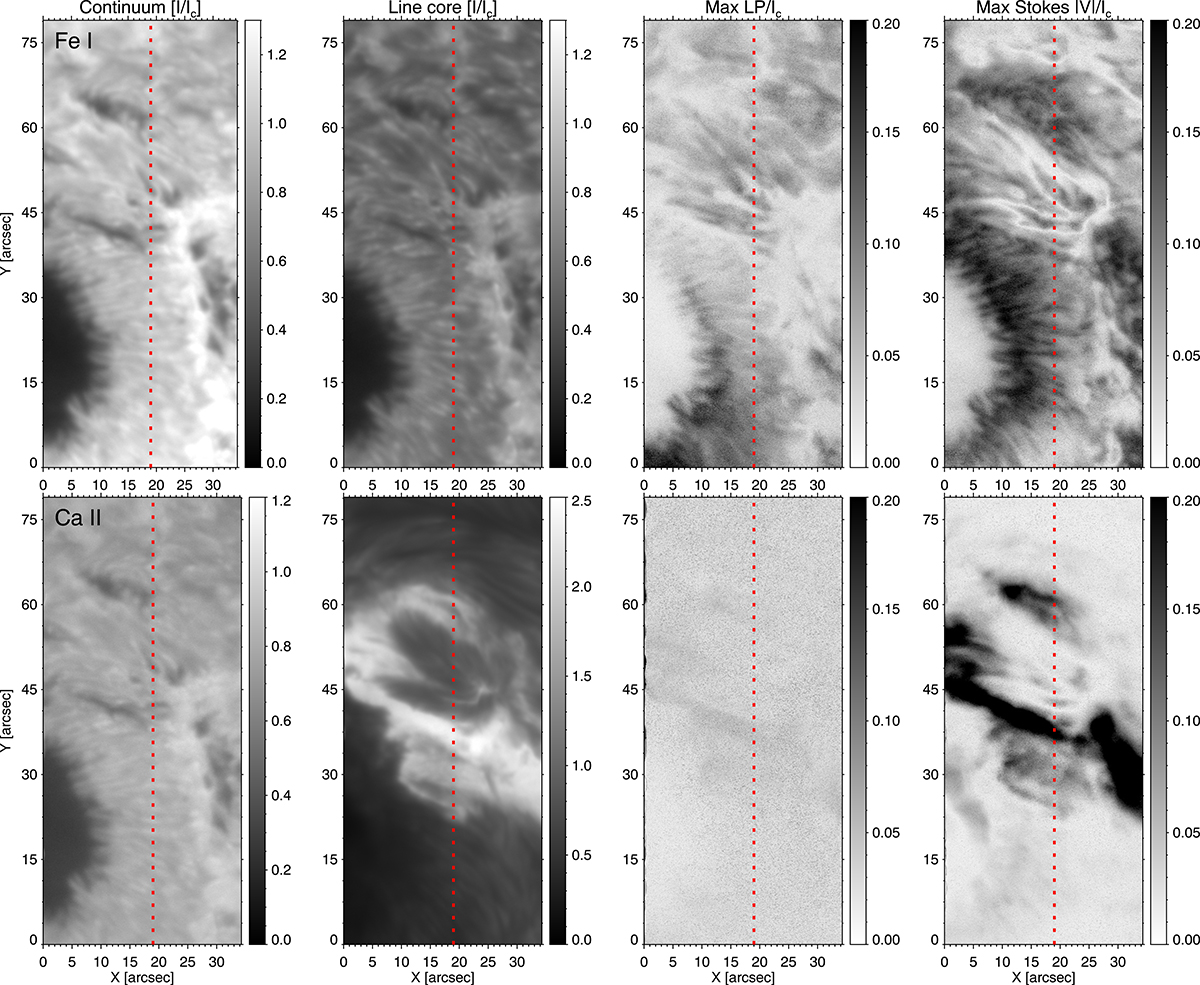
Spatial variation of various spectral features. From left to right, we show the continuum intensity, line core intensity, and maximum linear and circular polarisation signals. The top row corresponds to the Fe I 617.30 nm transition, while the bottom row shows the results for the Ca II 854.2 nm spectral line. The dotted vertical line highlights a region we examine later on. For the Fe I transition, the continuum wavelength is measured at 617.31 nm and the line core at 617.33 nm. Similarly, for the Ca II transition, the continuum and line core are measured at 853.98 nm and 854.22 nm, respectively.
Current usage metrics show cumulative count of Article Views (full-text article views including HTML views, PDF and ePub downloads, according to the available data) and Abstracts Views on Vision4Press platform.
Data correspond to usage on the plateform after 2015. The current usage metrics is available 48-96 hours after online publication and is updated daily on week days.
Initial download of the metrics may take a while.