Fig. 2
Download original image
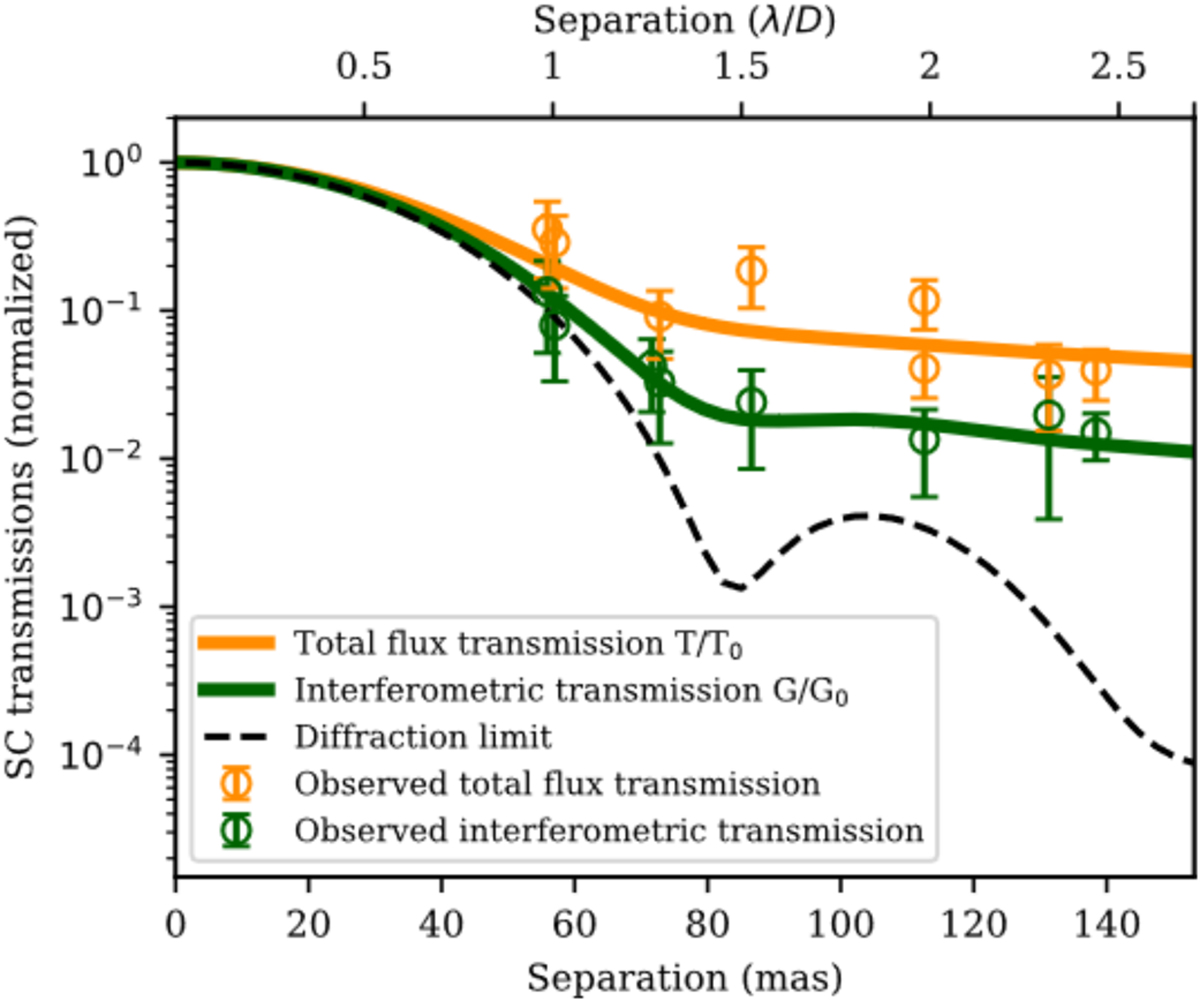
Total flux transmission (T) and interferometric transmission (G) as a function of the separation from the star on the UT. The points correspond to archival ExoGRAVITY observations around bright stars. The solid lines correspond to simulations matching the observations. The dashed line corresponds to a simulation of the transmission without atmospheric residuals but including a 20% bandwidth and 10 mas rms tip-tilt jitter.
Current usage metrics show cumulative count of Article Views (full-text article views including HTML views, PDF and ePub downloads, according to the available data) and Abstracts Views on Vision4Press platform.
Data correspond to usage on the plateform after 2015. The current usage metrics is available 48-96 hours after online publication and is updated daily on week days.
Initial download of the metrics may take a while.