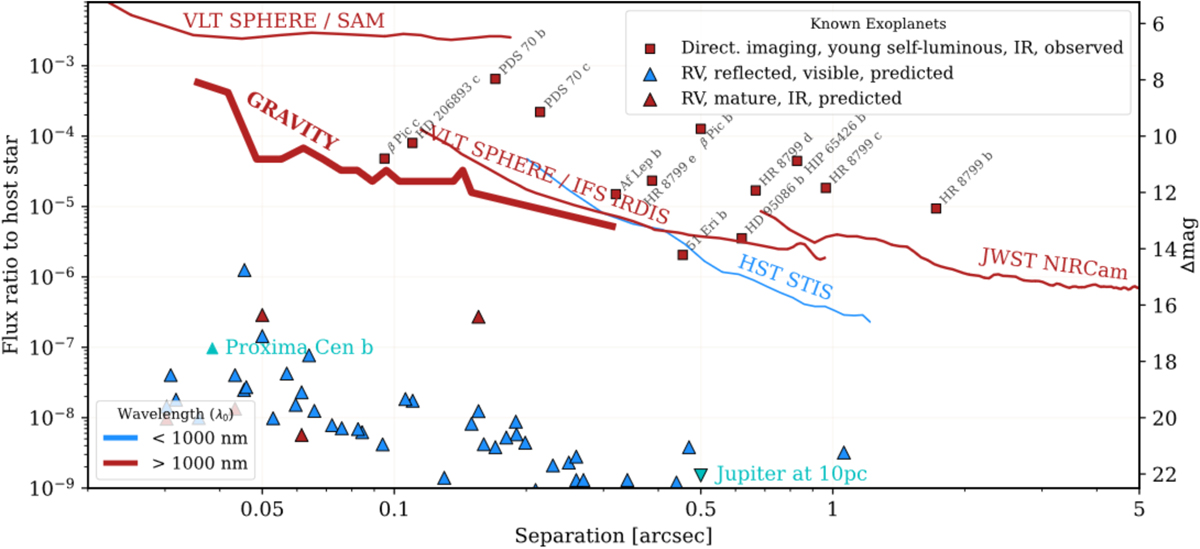
Fig. 12
Download original image
Detection limits of some representative instruments dedicated to direct observations of exoplanets. GRAVITY detection limit corresponds to the inner part of the on-axis mode of the instrument only. It is limited to 27 min exposure time and companions oriented parallel to the longest baselines of the VLTI. Plot adapted from Dr. Bailey script available at https://github.com/nasavbailey/DI-flux-ratio-plot. The HST/STIS curve is from Ren et al. (2017). VLT SPHERE/IFS IRDIS is from Langlois et al. (2021). VLT SPHERE/SAM is from Stolker et al. (2024). VLT JWST/NIRCam is from Carter et al. (2023). (Blue triangles) Estimated reflected flux in the visible for exoplanets observed using the radial velocity technique. The estimation follows a Lambertian model with radii fixed at 1 RJup and a geometric albedo of 0.5. (Red triangle) Estimated infrared flux for mature exoplanets observed using the radial velocity technique. Computed from equilibrium temperature estimates and planet radii fixed at 1 RJup. All visible and infrared estimated fluxes are based on Traub & Oppenheimer (2010).
Current usage metrics show cumulative count of Article Views (full-text article views including HTML views, PDF and ePub downloads, according to the available data) and Abstracts Views on Vision4Press platform.
Data correspond to usage on the plateform after 2015. The current usage metrics is available 48-96 hours after online publication and is updated daily on week days.
Initial download of the metrics may take a while.