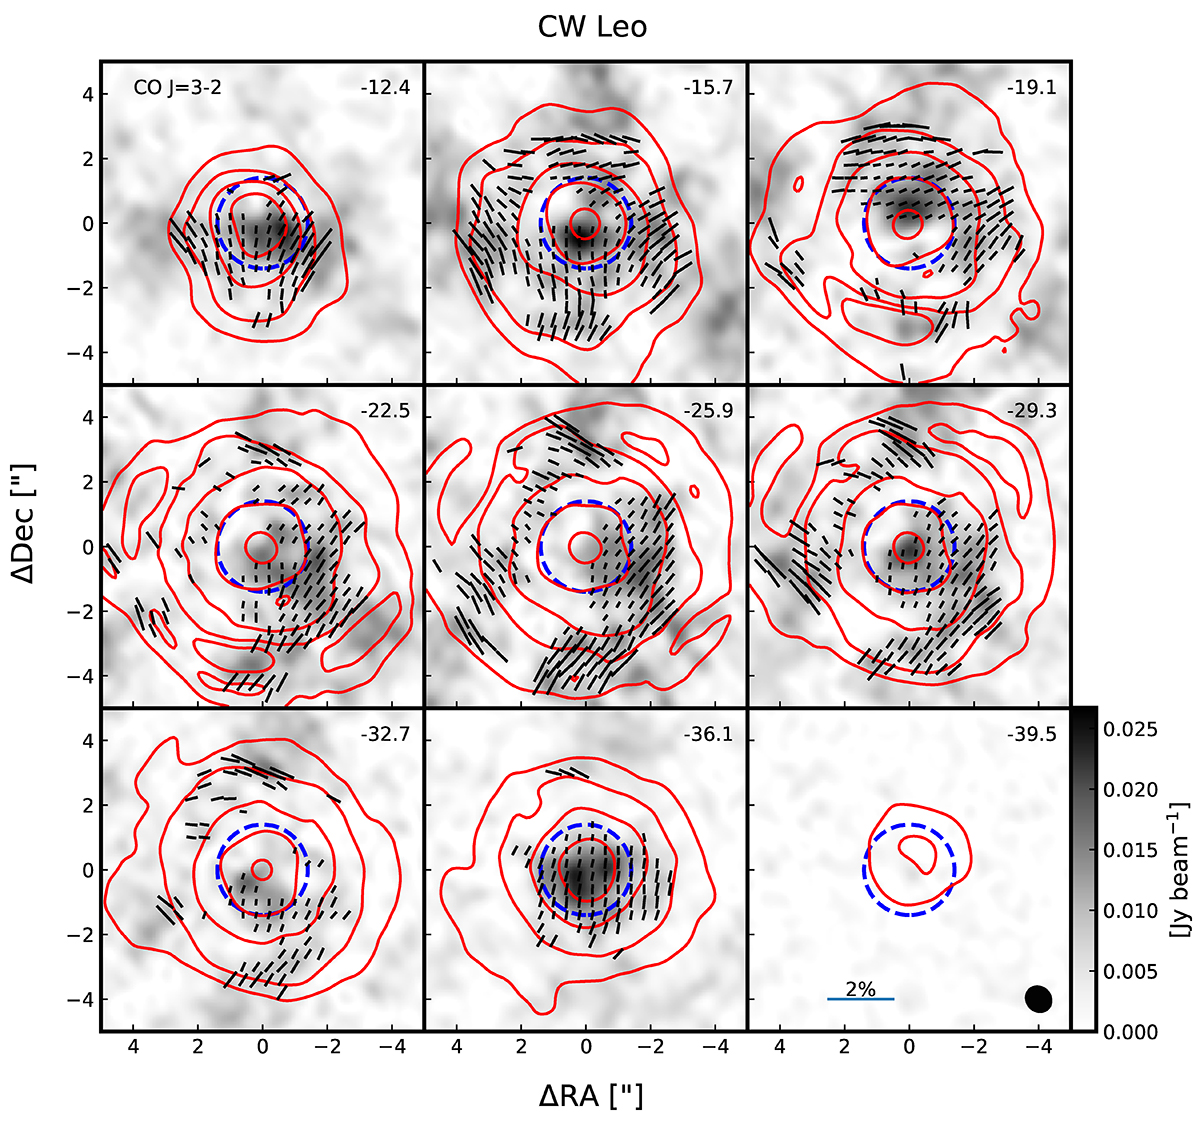
Fig. 2.
Download original image
Channel maps of the polarised CO J = 3 − 2 emission around the AGB star CW Leo. The solid red contours indicate the Stokes I total intensity emission at 5%, 10%, 20%, 40%, and 80% of the peak emission (ICO, peak = 17.89 Jy beam−1). The greyscale image is the linearly polarised emission, and the line segments denote the linear polarisation direction where emission is detected at > 5σP. The segments are scaled to the level of fractional polarisation, with the scale indicated in the bottom-right panel. The maximum polarisation is Pl, max = 1.18%. The beam size is denoted in the bottom-right panel, and all panels are labelled with the Vlsr velocity in kilometers per second. The stellar velocity is Vlsr, * = −26.5 km s−1. The dashed blue circles centred on the peak of the CO emission close to the stellar velocity indicates the radius (R ≈ 1.4″) at which we find that the direction of polarisation for CS changes from being neither tangential nor radial to predominantly tangential.
Current usage metrics show cumulative count of Article Views (full-text article views including HTML views, PDF and ePub downloads, according to the available data) and Abstracts Views on Vision4Press platform.
Data correspond to usage on the plateform after 2015. The current usage metrics is available 48-96 hours after online publication and is updated daily on week days.
Initial download of the metrics may take a while.