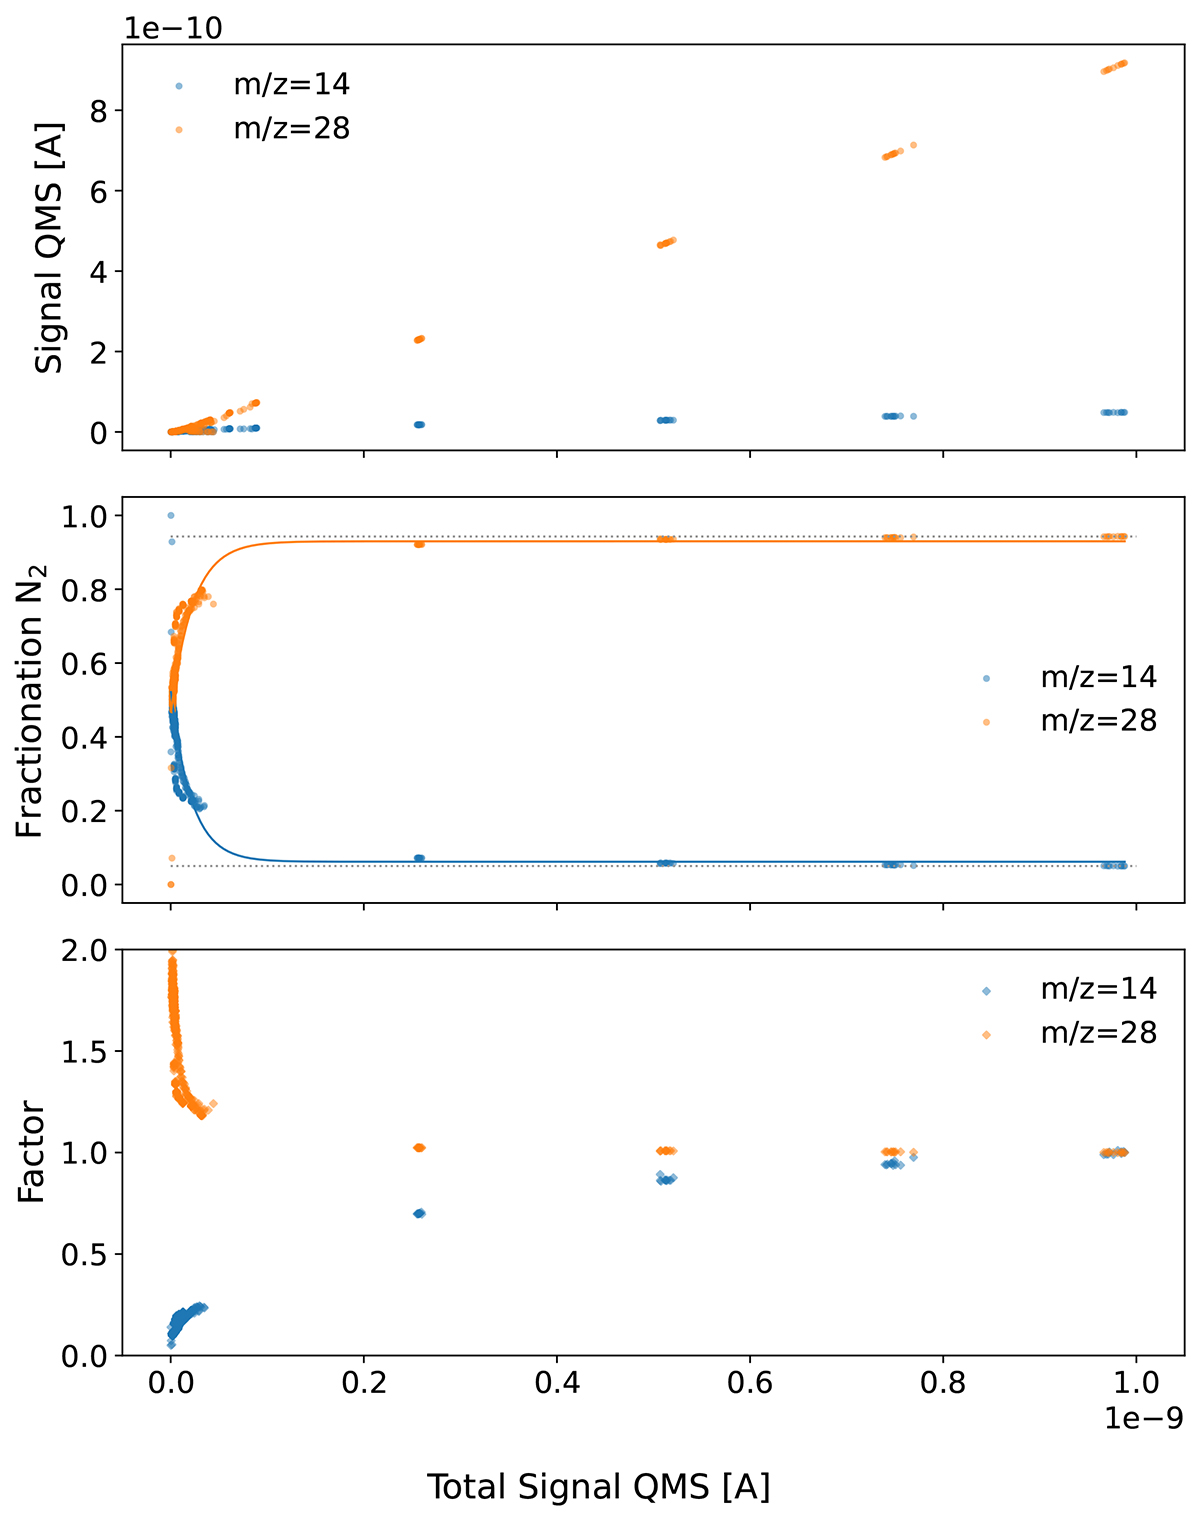
Fig. B.1.
Download original image
Investigation of the fractionation of m/z = 28 and m/z = 14 as a function of the Total Signal measured with the QMS from three different calibration measurements. This highlights the need for a correction of the data. The top panel shows the evolution of the signal measured with the QMS for both mass channels. The middle panel shows the fractionation pattern. The constant value reached at high enough Signal has been marked with a grey dotted line. The bottom panel then shows the factor with which the data have to be multiplied as a function of the total signal to obtain the ’true fragmentation’, which is shown in the middle panel as the dotted line. The details of the fit shown in the middle panel are collected in Table B.1.
Current usage metrics show cumulative count of Article Views (full-text article views including HTML views, PDF and ePub downloads, according to the available data) and Abstracts Views on Vision4Press platform.
Data correspond to usage on the plateform after 2015. The current usage metrics is available 48-96 hours after online publication and is updated daily on week days.
Initial download of the metrics may take a while.