Open Access
Fig. 7.
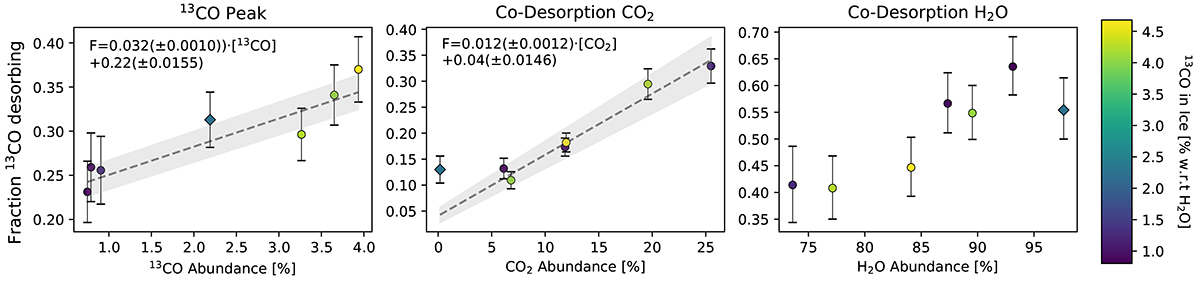
Download original image
Desorption behaviour of 13CO in the different regimes, colour coded for the total abundance of 13CO in the ice. Each column shows the different desorption events for 13CO. Diamond markers indicate the experiments without any CO2. The composition of the ices is collected in Table C.1.
Current usage metrics show cumulative count of Article Views (full-text article views including HTML views, PDF and ePub downloads, according to the available data) and Abstracts Views on Vision4Press platform.
Data correspond to usage on the plateform after 2015. The current usage metrics is available 48-96 hours after online publication and is updated daily on week days.
Initial download of the metrics may take a while.