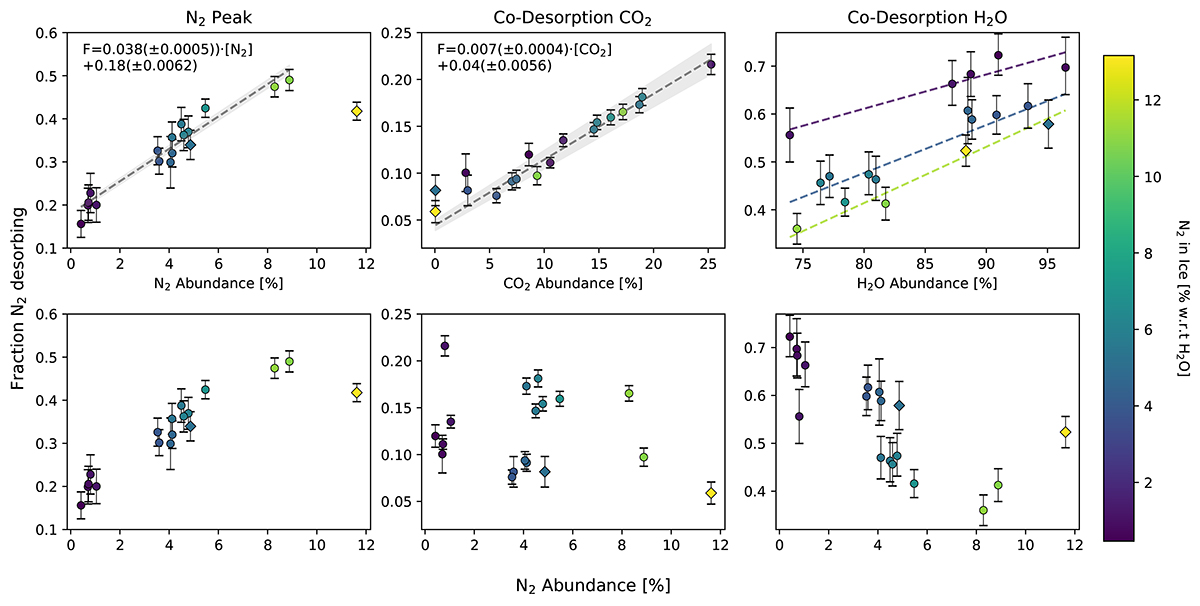
Fig. 4.
Download original image
Desorption behaviour of N2 in the different regimes, colour coded for the abundance of nitrogen in the ice with respect to water. Each column shows the different desorption events for N2 with the integration limits for the desorption events given in Table 2. The data points indicated with a diamond are the H2O:N2 ices, with negligible amounts of CO2 in the mixture. The colour assignment is the same as in Fig. 2. Top row: desorption behaviour of N2 as a function of the total N2 in the mixture, the total CO2 abundance in the mixture, and the H2O abundance respectively. The N2 desorption occurring at the pure N2 desorption peak and the CO2 co-desorption have been fitted with a linear function and the resulting best fit is shown in the corresponding panel (grey, dashed line). The grey shaded region indicates the standard deviation of the fit. For the water co-desorption no overall fit has been done, however, trends for the different N2 abundances have been indicated and colour coded. Bottom row: same data as in the top row, but plotted as a function of the total N2 abundance in the ice mixture.
Current usage metrics show cumulative count of Article Views (full-text article views including HTML views, PDF and ePub downloads, according to the available data) and Abstracts Views on Vision4Press platform.
Data correspond to usage on the plateform after 2015. The current usage metrics is available 48-96 hours after online publication and is updated daily on week days.
Initial download of the metrics may take a while.