Fig. 3.
Download original image
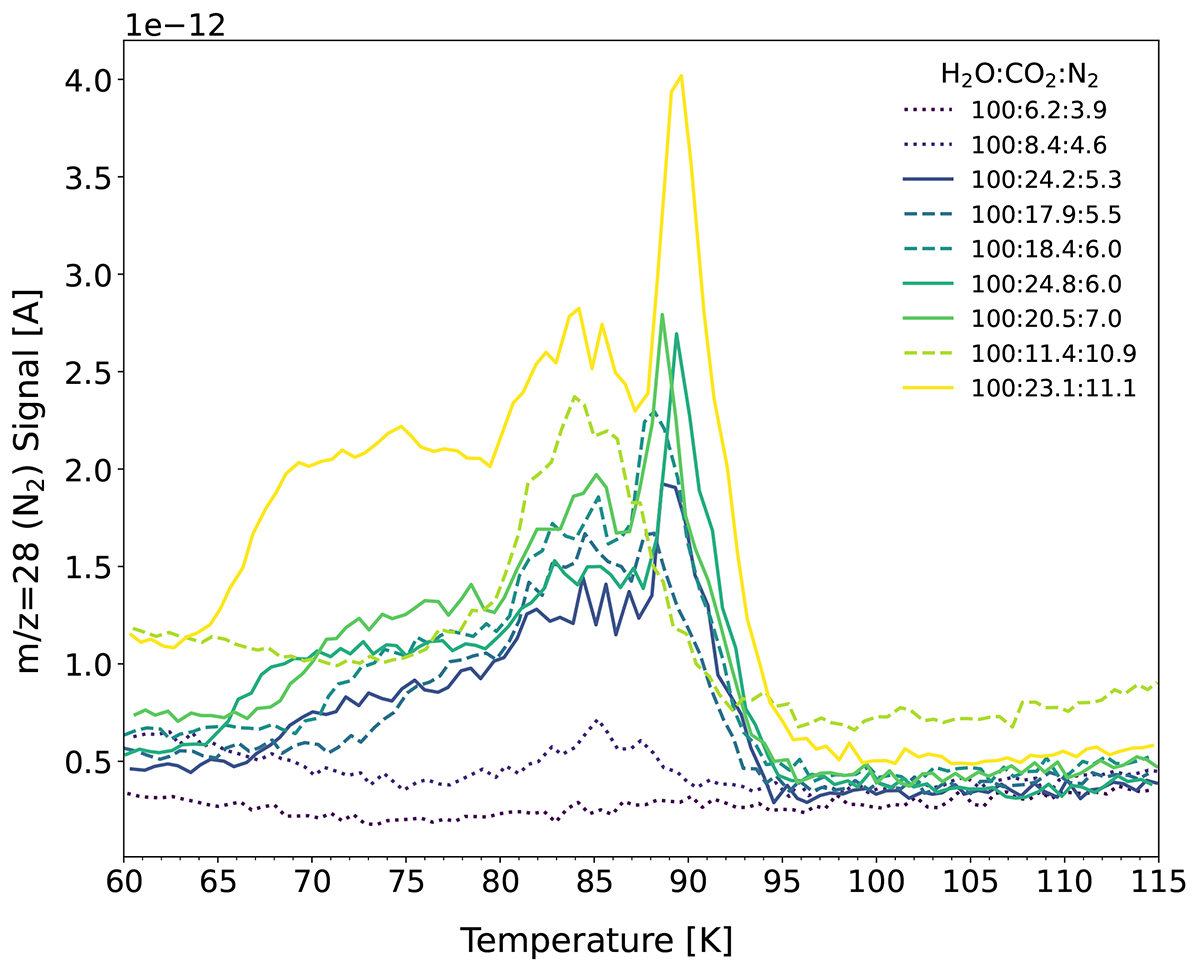
Zoom in of the N2 co-desorbing with CO2. The plots have been color coded for the abundance of N2 with respect to water. The linestyles indicate the amount of CO2 present with respect to water, with the assignment being: x < 10%:dotted, 10 < x < 20%: dashed, 20 < x%: solid. For readability, not all data measured are displayed.
Current usage metrics show cumulative count of Article Views (full-text article views including HTML views, PDF and ePub downloads, according to the available data) and Abstracts Views on Vision4Press platform.
Data correspond to usage on the plateform after 2015. The current usage metrics is available 48-96 hours after online publication and is updated daily on week days.
Initial download of the metrics may take a while.