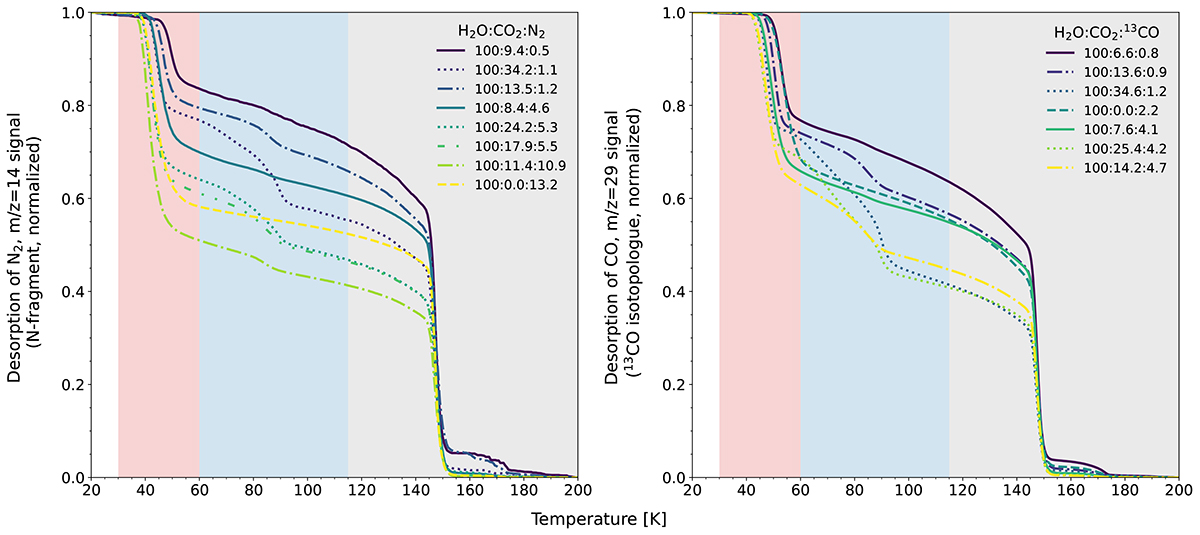
Fig. 2.
Download original image
Normalized desorption behaviour of N2 and 13CO as a function of temperature in the ices. Please note that not all measured data is displayed. A figure showing the complete data is shown in Appendix D. Left: evolution of N2, calculated from the m/z = 14 signal, during the TPD of different ices as a function of the temperature. The data have been sorted with respect to the N2 present in the ice mixture. The shaded regions correspond to the desorption regions in Table 2. A lighter line color corresponds to more N2. The linestyles indicate the amount of CO2 present with respect to water, with the assignment being: x < 1%:dashed, 1 < x < 5%: long dashes, 5 < x < 10%:solid, 10 < x < 15%: dashdot, 15 < x < 20%: dashdotdotted, 20 < x%: dotted. Right: evolution of 13CO, calculated from the m/z = 29 signal, as a function of the temperature. The data have been sorted with respect to the 13CO present in the ice mixture. A lighter color corresponds to more 13CO. The linestyles indicate the amount of CO2 present with respect to water, with the assignment of the linestyles being the same as for the left panel.
Current usage metrics show cumulative count of Article Views (full-text article views including HTML views, PDF and ePub downloads, according to the available data) and Abstracts Views on Vision4Press platform.
Data correspond to usage on the plateform after 2015. The current usage metrics is available 48-96 hours after online publication and is updated daily on week days.
Initial download of the metrics may take a while.