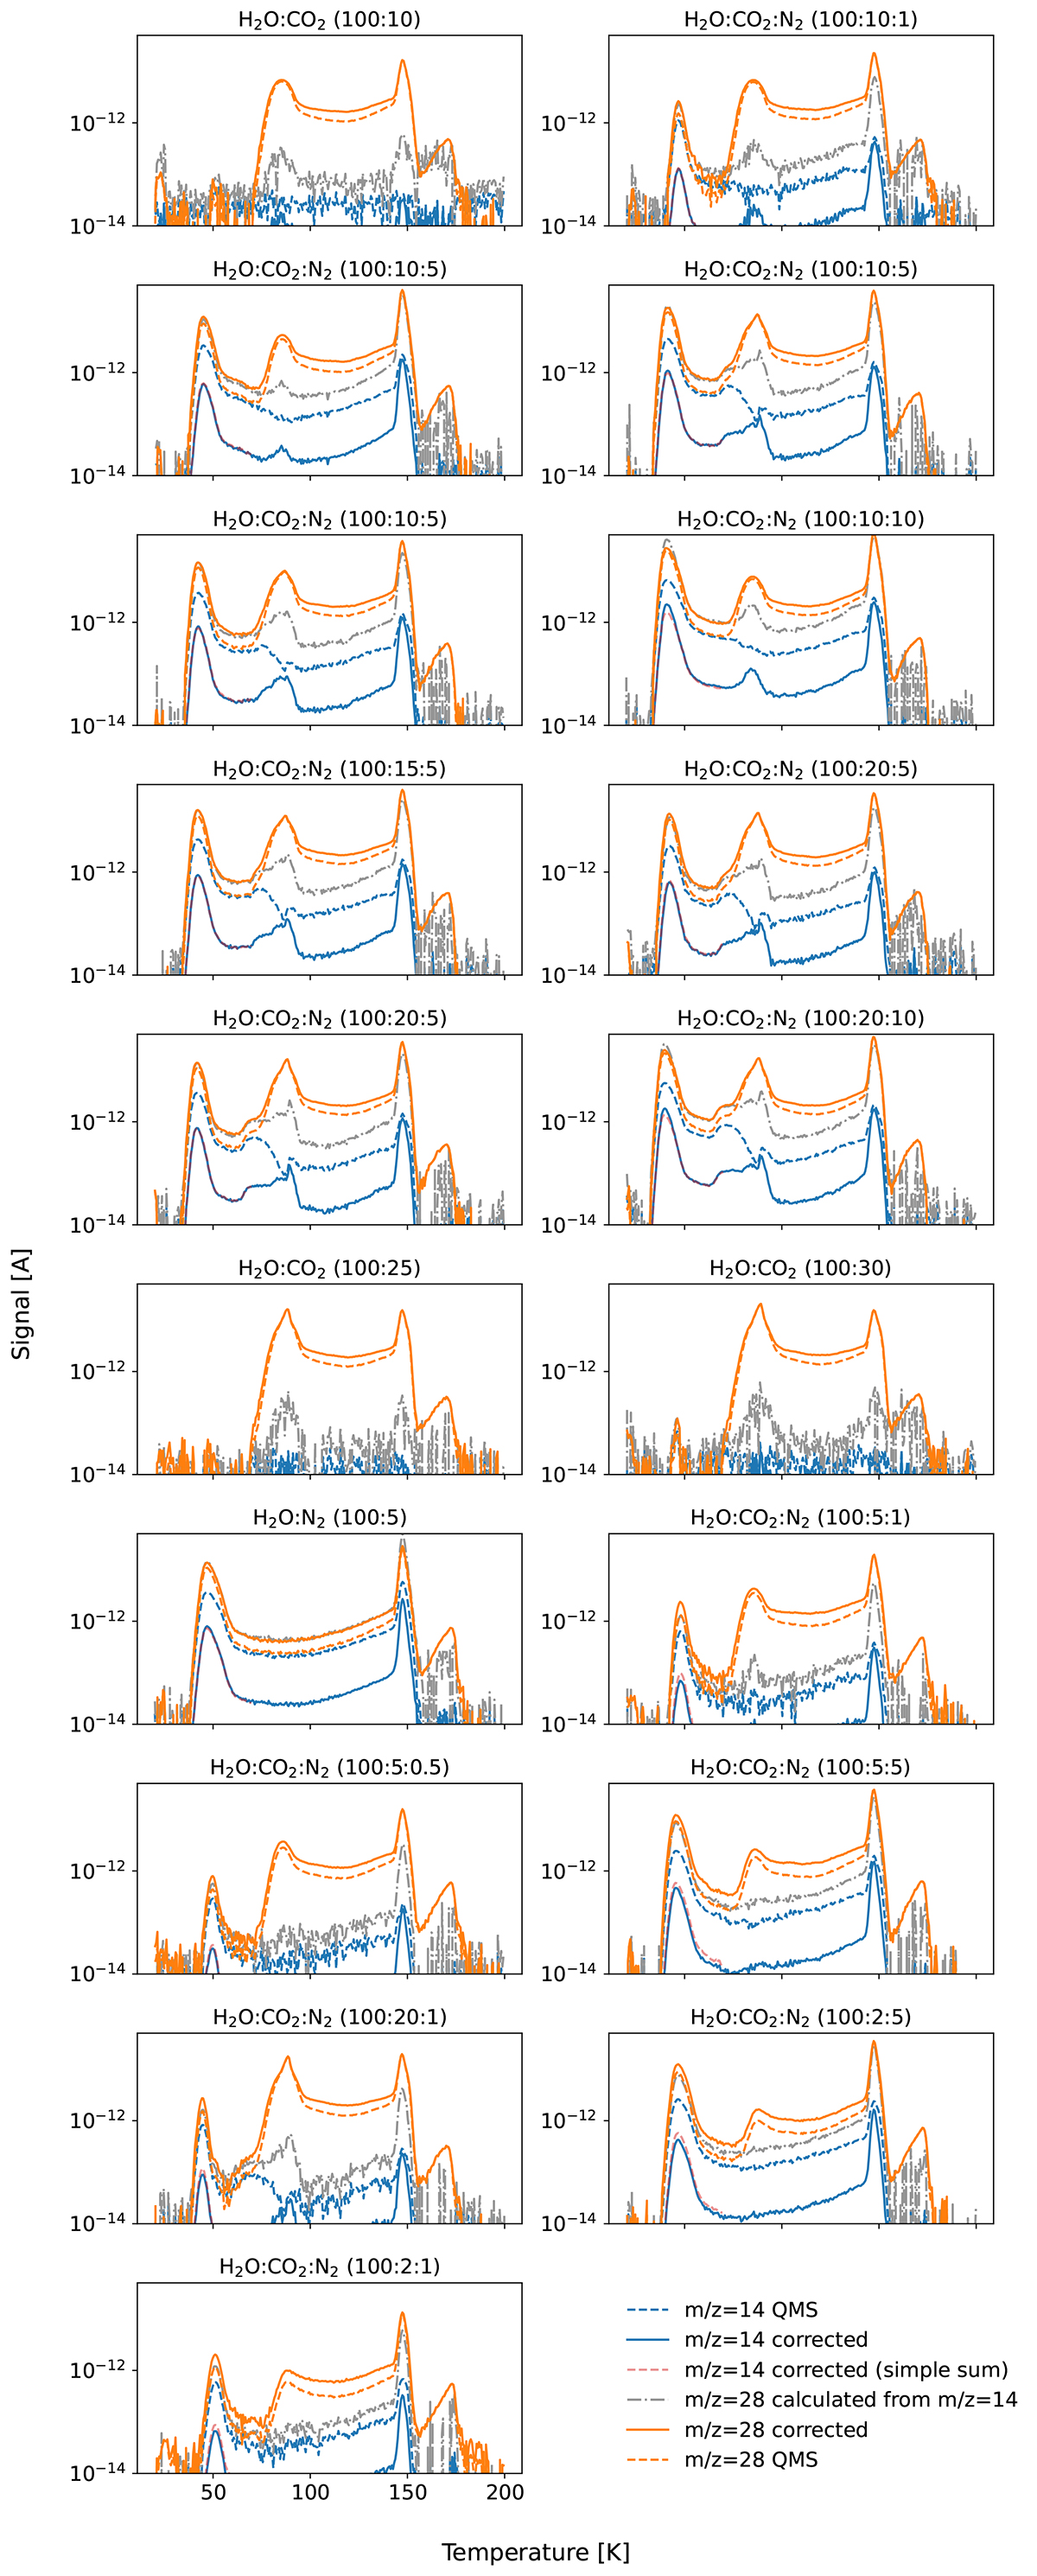
Fig. B.5.
Download original image
This figure shows the correction (described in Sect. 2.3) applied to all N2 data (grey, dash-dotted). The m/z = 28 signal consists out of contributions from both N2 and CO2, which necessitates the correction. Furthermore, a simple data correction has been performed, namely only summing the m/z = 28 and m/z = 14 signal and correcting for the expected fractionation pattern (red, dashed), which gives very similar results in the region where the only contribution to m/z = 28 is N2.
Current usage metrics show cumulative count of Article Views (full-text article views including HTML views, PDF and ePub downloads, according to the available data) and Abstracts Views on Vision4Press platform.
Data correspond to usage on the plateform after 2015. The current usage metrics is available 48-96 hours after online publication and is updated daily on week days.
Initial download of the metrics may take a while.