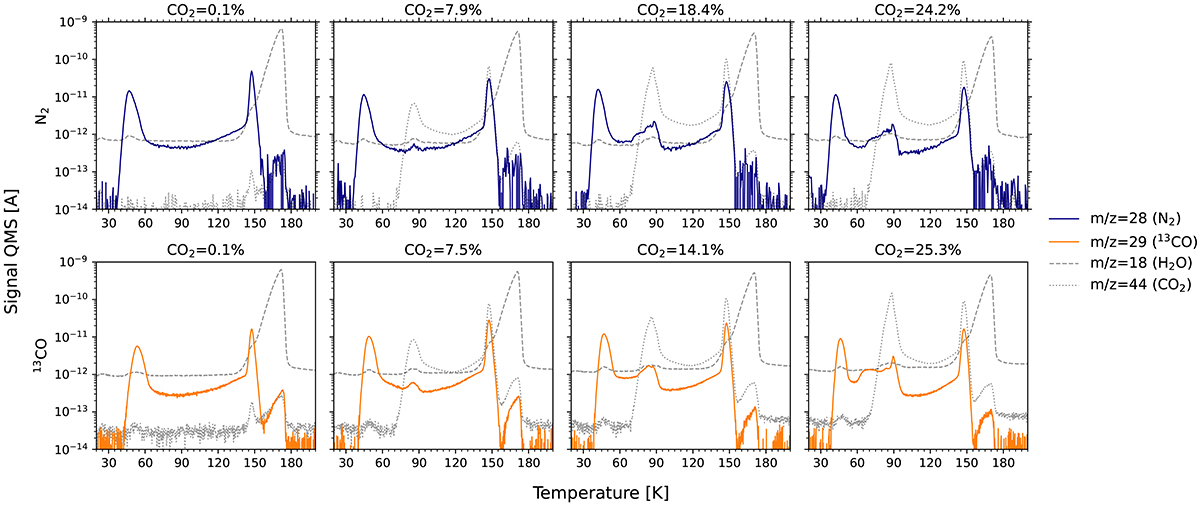
Fig. 1.
Download original image
Desorption traces of N2 and 13CO in H2O:CO2:N2 and H2O:CO2:13CO ices respectively as a function of temperature during the TPD. Top row: desorption traces of N2, (solid, blue), CO2 (grey, dotted) and H2O (grey, dashed) for different ice experiments. For the presented data the N2 contribution has been calculated to be between 3% and 5% with respect to water, therefore assumed to be relatively constant. The CO2 contribution is shown at the top with respect to water and increases from left to right. For N2, the corrected data have been calculated from the m/z = 14 data, corresponding to the N fragment, as described in Appendix B, therefore resulting in more noise than the 13CO data. Neither the CO2 nor the H2O data have been corrected or baseline subtracted for this plot. Bottom row: desorption trace for m/z = 29 (13CO, orange) for different ice experiments, with the CO2 and H2O desorption traces shown as well. The 13CO contributions have been calculated to be between 3% and 4% with respect to water, except for the first experiment, in which the 13CO has been calculated to be ∼2.5%. The 13CO signal has been corrected and baseline subtracted, whereas for the CO2 and H2O traces no corrections have been performed. Please note that for the 13CO measurements, the background pressure has been higher than for the N2 measurements, resulting in a larger background for H2O and CO2.
Current usage metrics show cumulative count of Article Views (full-text article views including HTML views, PDF and ePub downloads, according to the available data) and Abstracts Views on Vision4Press platform.
Data correspond to usage on the plateform after 2015. The current usage metrics is available 48-96 hours after online publication and is updated daily on week days.
Initial download of the metrics may take a while.