Fig. 2.
Download original image
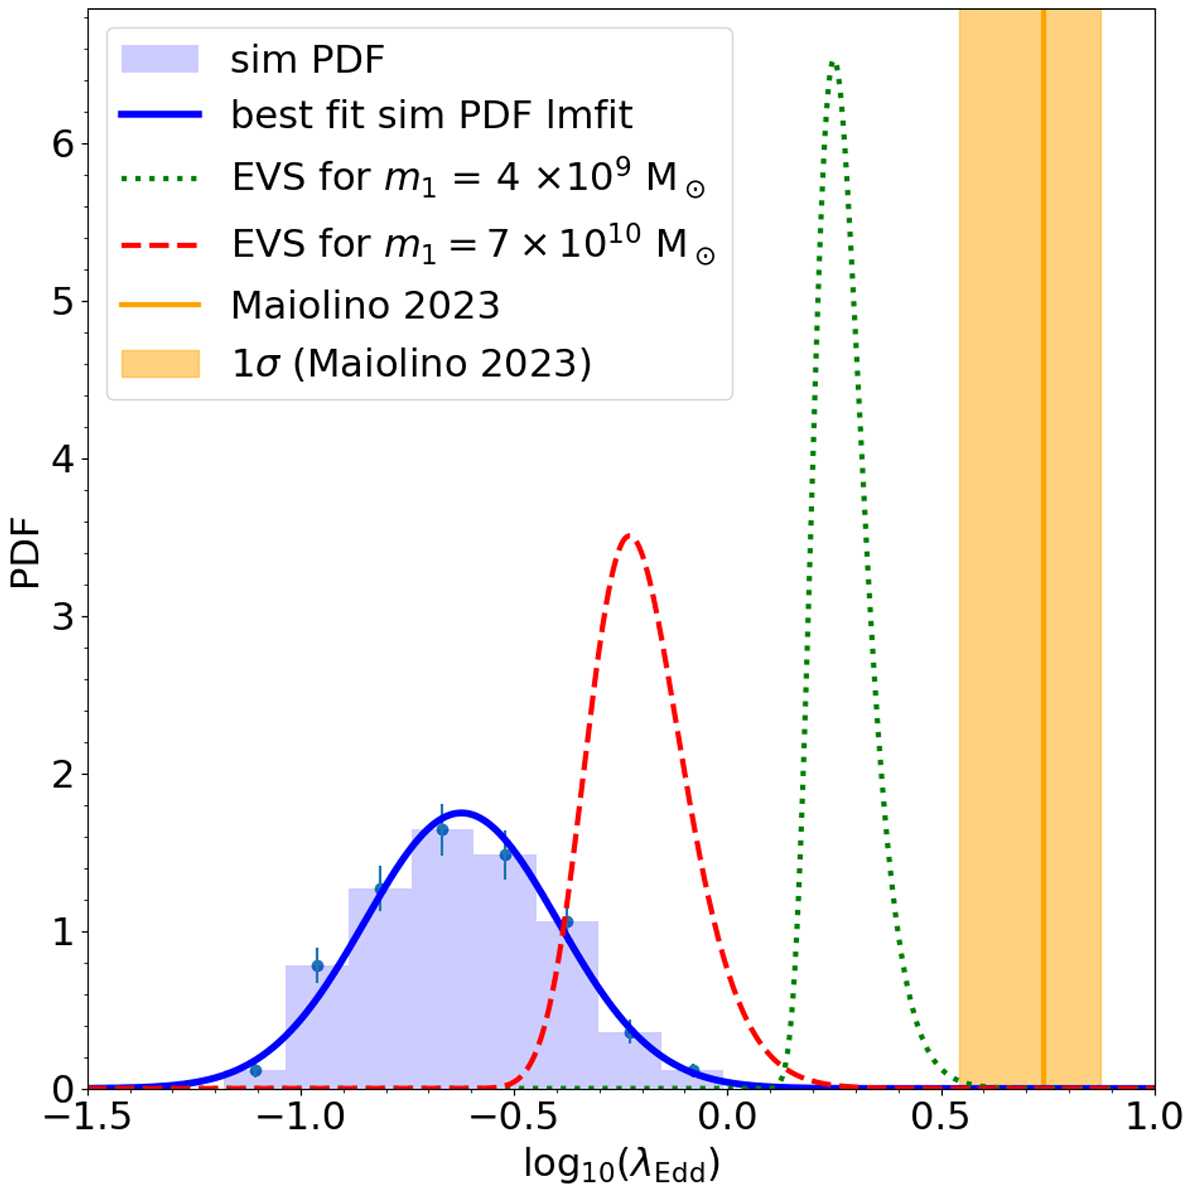
Extreme value statistics PDF as a function of the Eddington ratio for a GN-z11-like AGN. Blue solid line shows the best-fit Gaussian (reduced ![]() ) to the Eddington ratio distribution from the V21 simulation for BHs in the redshift range 10 < z < 11 and MBH > 106 M⊙. The peak of the best fit is around λEdd ∼ 0.25. The dashed (dotted) red (green) line represents the EVS for the largest (smallest) considered value of m1 (see text). The orange solid line (shaded region) shows the GN-z11 Eddington ratio (1σ uncertainty) estimated by Maiolino et al. (2024).
) to the Eddington ratio distribution from the V21 simulation for BHs in the redshift range 10 < z < 11 and MBH > 106 M⊙. The peak of the best fit is around λEdd ∼ 0.25. The dashed (dotted) red (green) line represents the EVS for the largest (smallest) considered value of m1 (see text). The orange solid line (shaded region) shows the GN-z11 Eddington ratio (1σ uncertainty) estimated by Maiolino et al. (2024).
Current usage metrics show cumulative count of Article Views (full-text article views including HTML views, PDF and ePub downloads, according to the available data) and Abstracts Views on Vision4Press platform.
Data correspond to usage on the plateform after 2015. The current usage metrics is available 48-96 hours after online publication and is updated daily on week days.
Initial download of the metrics may take a while.