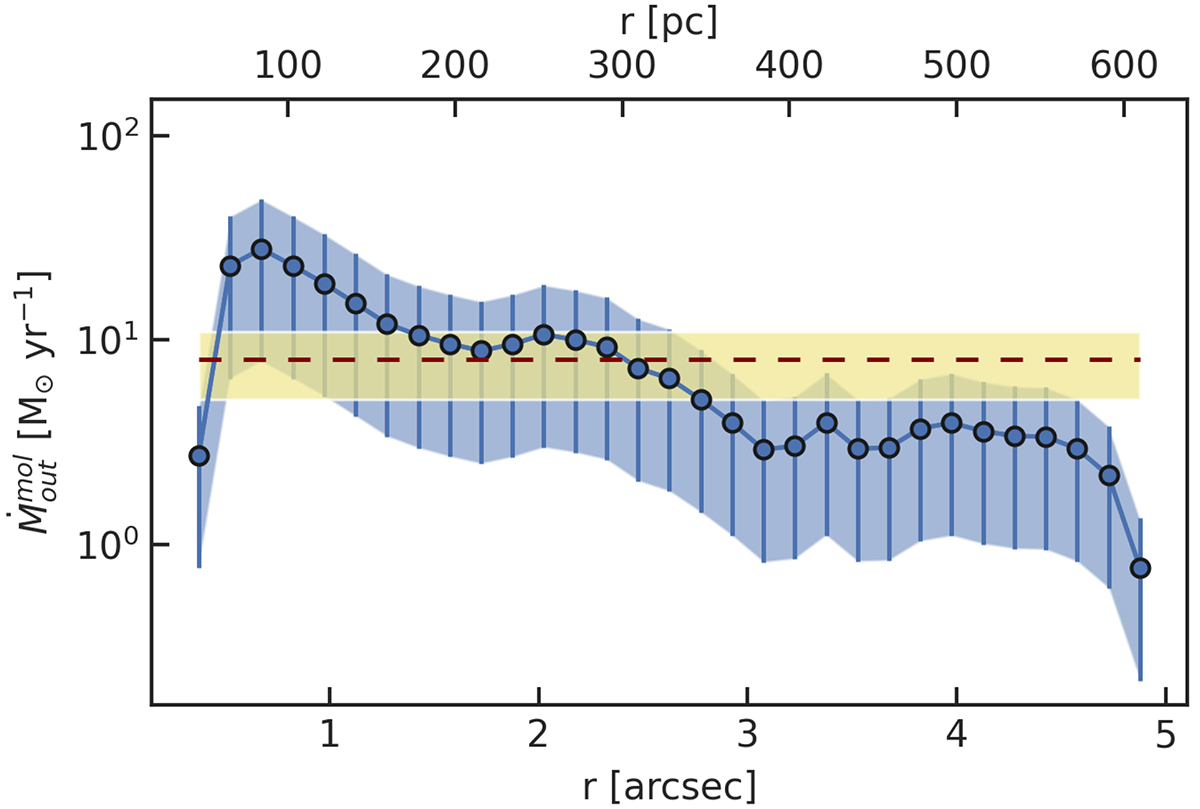
Fig. 9.
Download original image
Molecular gas mass outflow rate as a function of the deprojected distance from the AGN (on the plane of the galaxy). The molecular gas mass includes the helium contribution. The blue dots correspond to the values computed with the 3DB model radial velocities and CO(3 − 2) intensities of Fig. 8. The blue shading and errorbars represent the variation in r31 and XCO (see text for details). The red dashed line is the integrated mass outflow rate, 8 ± 3 M⊙ yr−1, with the shaded yellow region representing its uncertainty.
Current usage metrics show cumulative count of Article Views (full-text article views including HTML views, PDF and ePub downloads, according to the available data) and Abstracts Views on Vision4Press platform.
Data correspond to usage on the plateform after 2015. The current usage metrics is available 48-96 hours after online publication and is updated daily on week days.
Initial download of the metrics may take a while.