Fig. 8.
Download original image
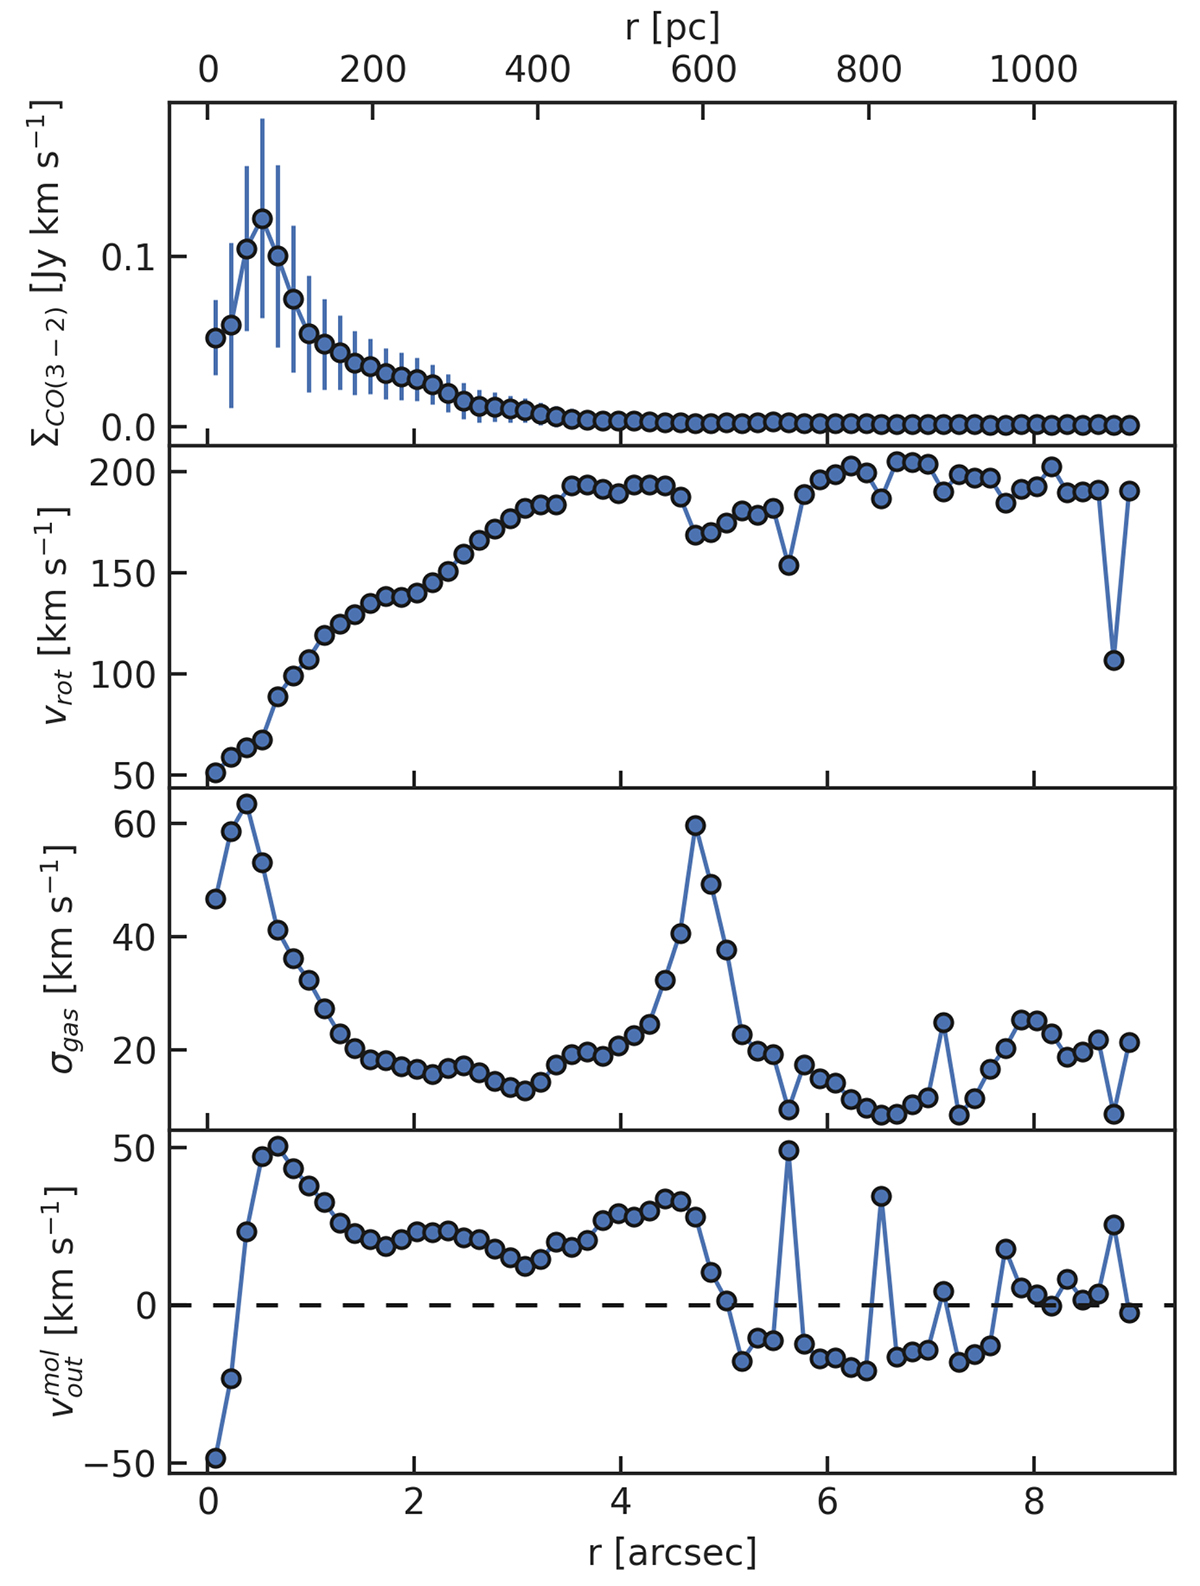
Radial profiles of the molecular gas derived with 3DB. From top to bottom: the CO(3 − 2) surface density, the rotational velocity (same as the yellow dots in the top panel of Fig. 6), the velocity dispersion and the outflow velocity, all as a function of deprojected distance from the AGN (on the plane of the galaxy). The dashed black line in the bottom panel is the zero line, dividing between ouflow (![]() ) and inflow (
) and inflow (![]() ).
).
Current usage metrics show cumulative count of Article Views (full-text article views including HTML views, PDF and ePub downloads, according to the available data) and Abstracts Views on Vision4Press platform.
Data correspond to usage on the plateform after 2015. The current usage metrics is available 48-96 hours after online publication and is updated daily on week days.
Initial download of the metrics may take a while.