Open Access
Fig. 7.
Download original image
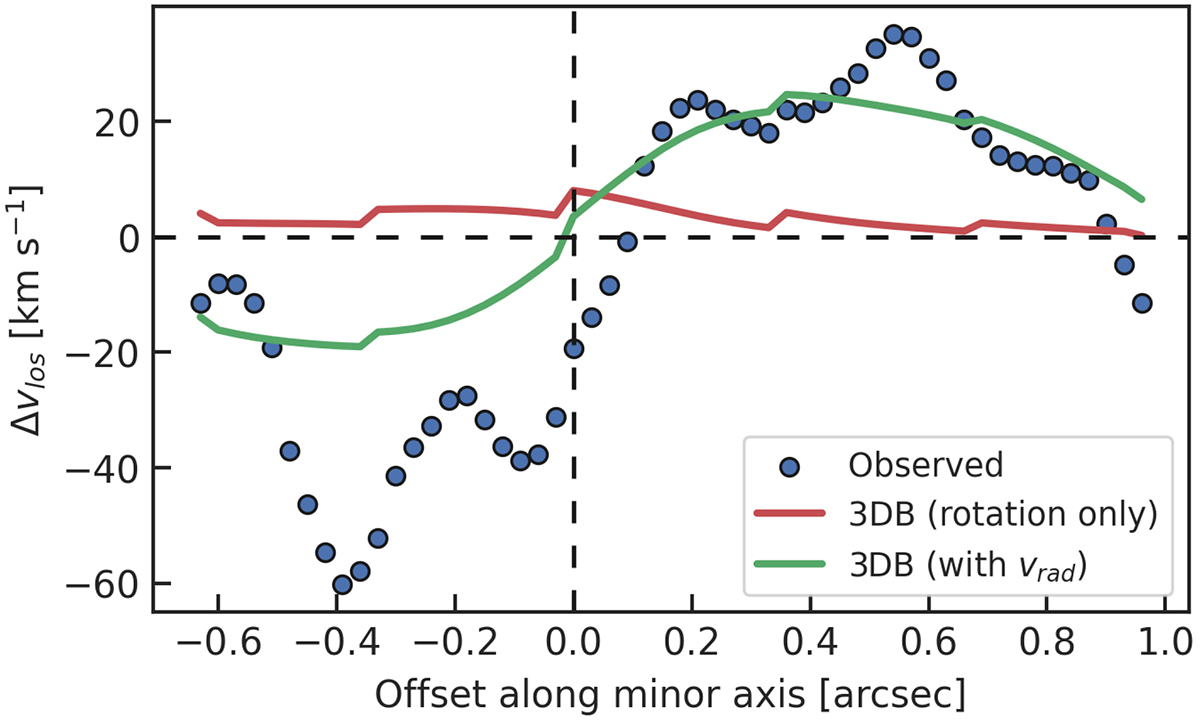
Relative velocities of CO(3 − 2) along the minor axis, extracted and averaged from a slit width of 3 pixels (corresponding to a projected width of 0.09″). The blue circles are the observed values, not weighted for the emitted flux. The green and red lines are the 3DB models with and without a radial velocity component.
Current usage metrics show cumulative count of Article Views (full-text article views including HTML views, PDF and ePub downloads, according to the available data) and Abstracts Views on Vision4Press platform.
Data correspond to usage on the plateform after 2015. The current usage metrics is available 48-96 hours after online publication and is updated daily on week days.
Initial download of the metrics may take a while.