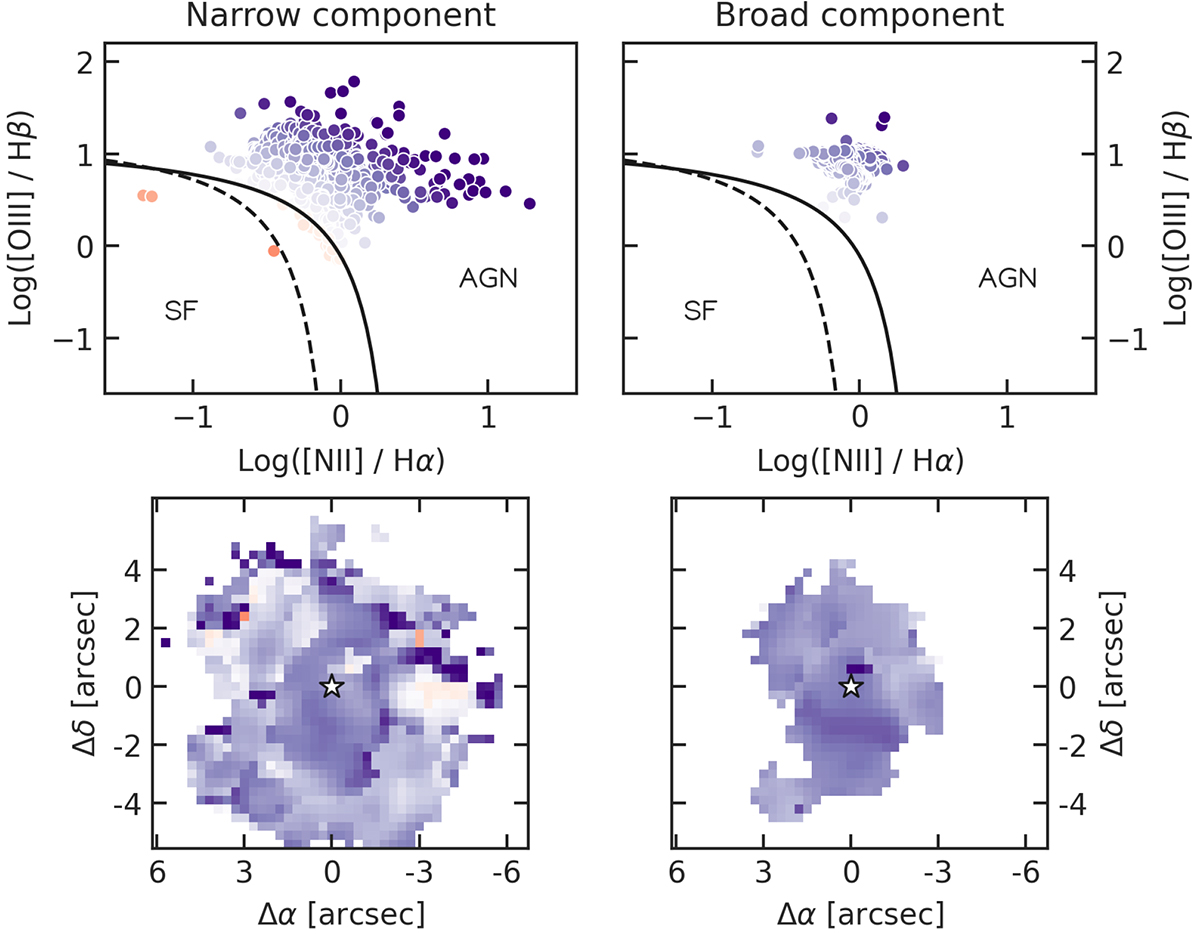
Fig. C.1.
Download original image
Diagnostic Baldwin, Phillips, Telervich (BPT) diagram (Baldwin et al. 1981; Veilleux & Osterbrock 1987) of [OIII]/Hβ vs [NII]/Hα line ratios, for the narrow (left panels) and broad (right panels) components of the ionised gas. Solid and dashed black lines are empirical curves derived by Kewley et al. (2001) and Kauffmann et al. (2003), that separate different excitation mechanisms, marked on the plots as SF (star formation) and AGN. The spaxels are coloured depending on their distance from the separation lines, and are plotted with the same colours in the spatially resolved maps (bottom panels). The black star marks the AGN position.
Current usage metrics show cumulative count of Article Views (full-text article views including HTML views, PDF and ePub downloads, according to the available data) and Abstracts Views on Vision4Press platform.
Data correspond to usage on the plateform after 2015. The current usage metrics is available 48-96 hours after online publication and is updated daily on week days.
Initial download of the metrics may take a while.