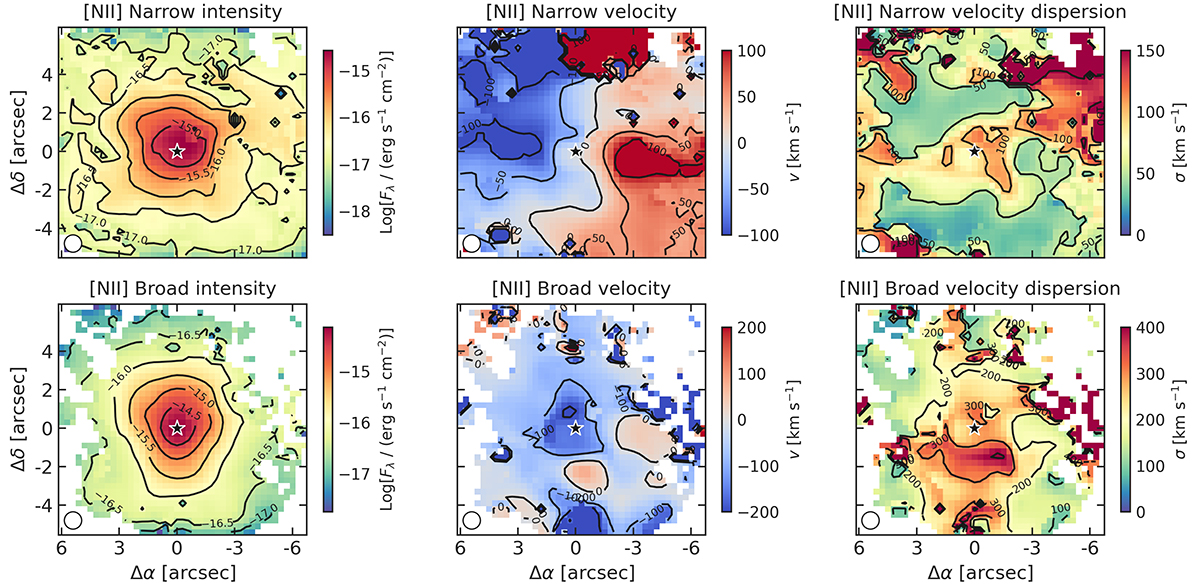
Fig. B.1.
Download original image
Gaussian decomposition made by ALUCINE for the Hα line. Top and bottom panels are for narrow and broad component, respectively, while in the three columns, from left to right, are the intensity, velocity, and velocity dispersion maps. The AGN position is marked with a black star symbol, and distances are measured from it. The white circle in the bottom left is the MEGARA seeing conditions.
Current usage metrics show cumulative count of Article Views (full-text article views including HTML views, PDF and ePub downloads, according to the available data) and Abstracts Views on Vision4Press platform.
Data correspond to usage on the plateform after 2015. The current usage metrics is available 48-96 hours after online publication and is updated daily on week days.
Initial download of the metrics may take a while.