Fig. 2.
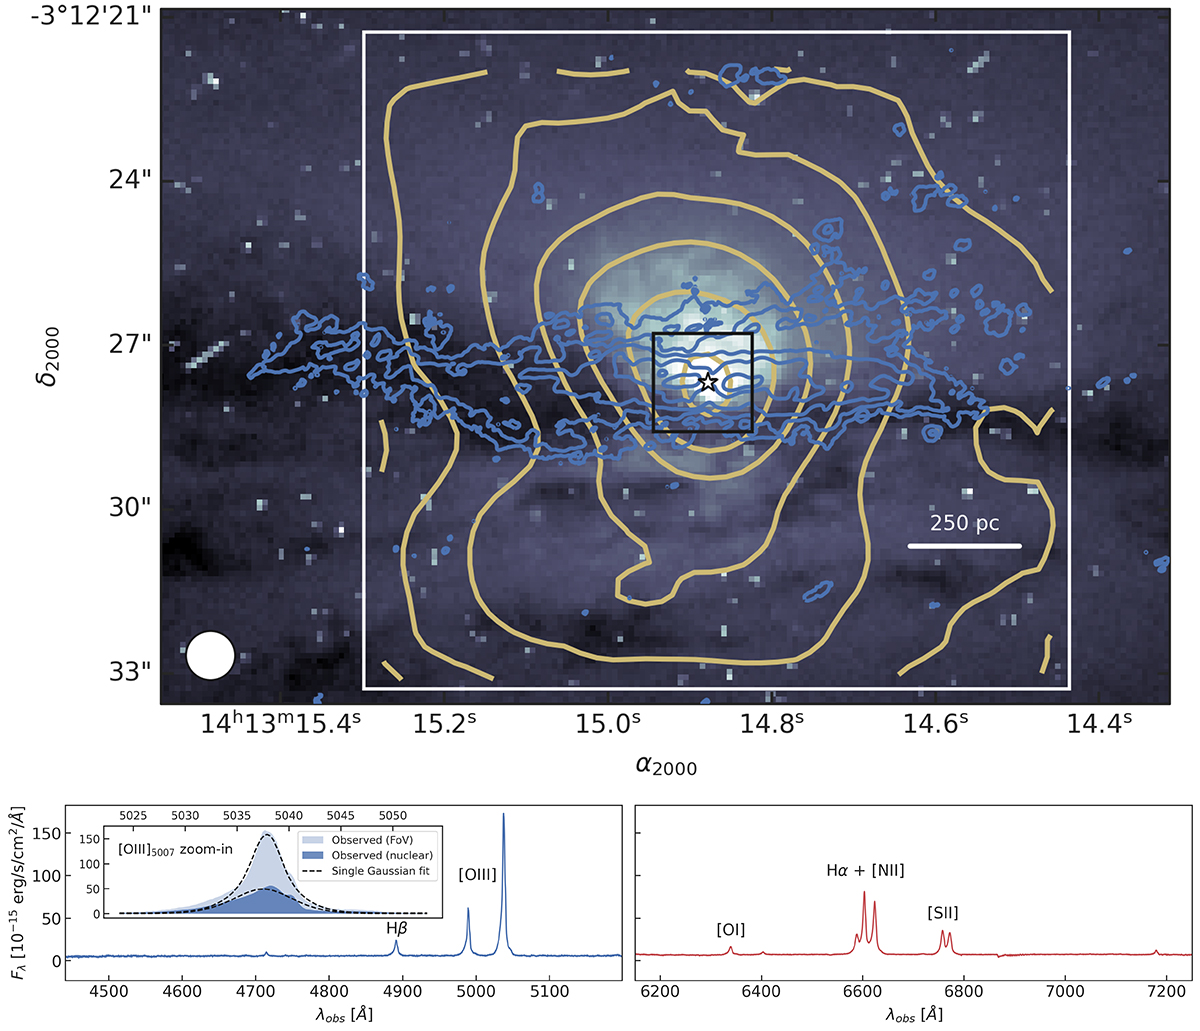
Download original image
Optical image and spectra of the central region of NGC 5506. Top panel: GTC/MEGARA [OIII] (λe = 5007 Å, in orange) and CO (λe = 870 μm, in blue) contours over the HST/F606W image of NGC 5506 (Malkan et al. 1998). The [OIII] contour levels, from the single-component Gaussian fit, have a logarithmic spacing from 3σ to 80% of the peak intensity in steps of 0.5 dex, while the CO(3 − 2) contours are the same of Fig. 1. The white star symbol is the AGN position, as determined in Sect. 2.2. The black and white squares are the nuclear region, with size 1.8 arcsec ∼225 pc, observed by X-shooter (see Davies et al. 2020), and the MEGARA FoV (12.5″ × 11.3″ ∼ 1.5 kpc × 1.4 kpc), respectively. The white circle in the bottom left is the MEGARA seeing conditions (diameter 0.9″). Bottom panel: left and right panels contain the spectra (integrated within the MEGARA FoV) revealed with the MEGARA LR-B and LR-R gratings, respectively, with names of identified emission lines and doublets. The inset is the zoom-in of a [OIII] line (after continuum subtraction): the blue shadings are the observed spectra of the MEGARA FoV and of the nuclear region, the black dashed lines are the fits with a single Gaussian. The inset axes have the same units of the outer panel.
Current usage metrics show cumulative count of Article Views (full-text article views including HTML views, PDF and ePub downloads, according to the available data) and Abstracts Views on Vision4Press platform.
Data correspond to usage on the plateform after 2015. The current usage metrics is available 48-96 hours after online publication and is updated daily on week days.
Initial download of the metrics may take a while.