Fig. 16.
Download original image
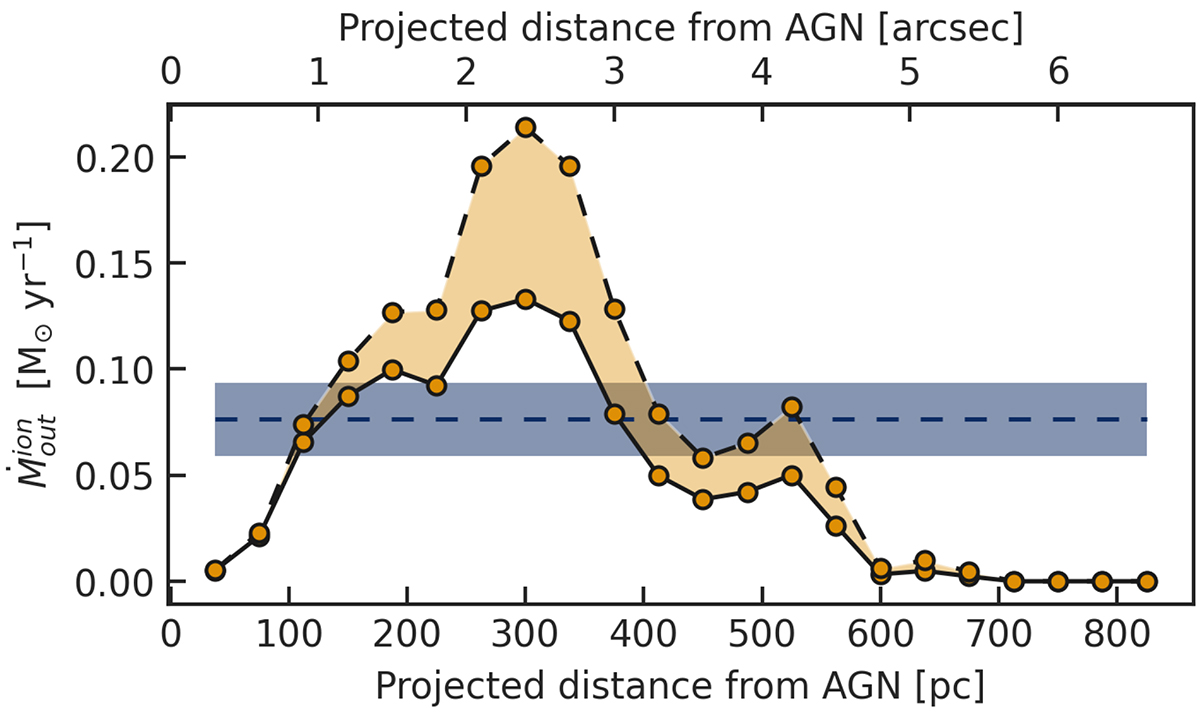
Radial profile of the ionised mass outflow rate ![]() as a function of the average projected distance from the AGN. Solid and dashed lines are estimates of
as a function of the average projected distance from the AGN. Solid and dashed lines are estimates of ![]() by using the average and the maximum
by using the average and the maximum ![]() at every radius. The blue dashed line is the integrated mass outflow rate, 0.076 ± 0.017 M⊙ yr−1, with the blue shading representing its uncertainty.
at every radius. The blue dashed line is the integrated mass outflow rate, 0.076 ± 0.017 M⊙ yr−1, with the blue shading representing its uncertainty.
Current usage metrics show cumulative count of Article Views (full-text article views including HTML views, PDF and ePub downloads, according to the available data) and Abstracts Views on Vision4Press platform.
Data correspond to usage on the plateform after 2015. The current usage metrics is available 48-96 hours after online publication and is updated daily on week days.
Initial download of the metrics may take a while.