Fig. 15.
Download original image
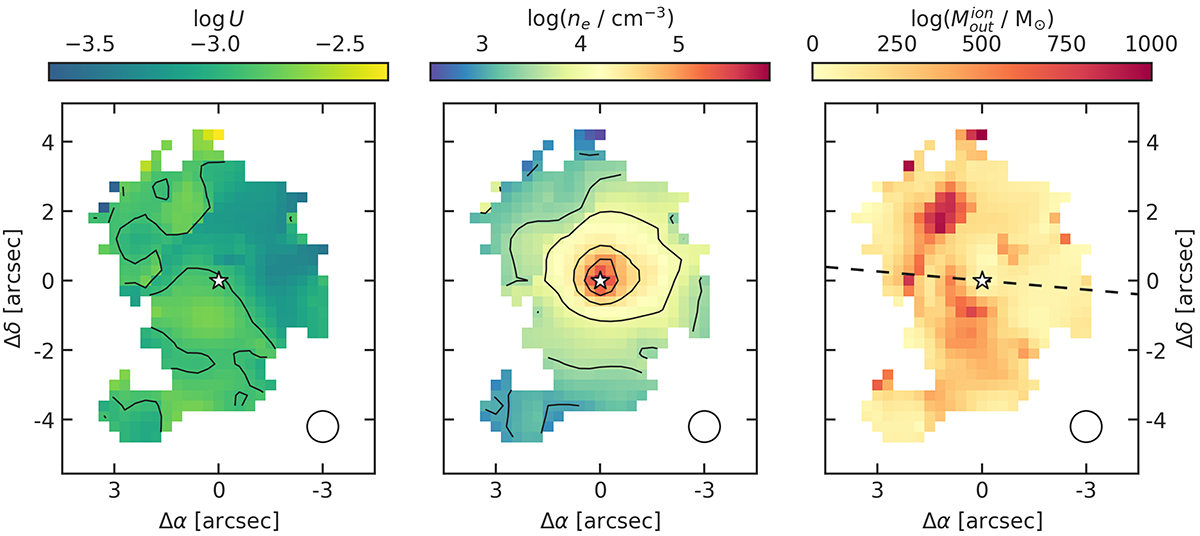
From left to right: outflowing [OIII] ionisation parameter log U, electron density ne, and mass ![]() . Contours are at log U = −2.9 (i.e. its median value), log(ne/cm−3) = (3, 3.5, 4, 4.5, 5). The white star symbol marks the AGN position, and the dashed black line in the top-right panel is the kinematic major axis (PA = 265°). The white circle in the bottom right of each panel is the MEGARA seeing conditions.
. Contours are at log U = −2.9 (i.e. its median value), log(ne/cm−3) = (3, 3.5, 4, 4.5, 5). The white star symbol marks the AGN position, and the dashed black line in the top-right panel is the kinematic major axis (PA = 265°). The white circle in the bottom right of each panel is the MEGARA seeing conditions.
Current usage metrics show cumulative count of Article Views (full-text article views including HTML views, PDF and ePub downloads, according to the available data) and Abstracts Views on Vision4Press platform.
Data correspond to usage on the plateform after 2015. The current usage metrics is available 48-96 hours after online publication and is updated daily on week days.
Initial download of the metrics may take a while.