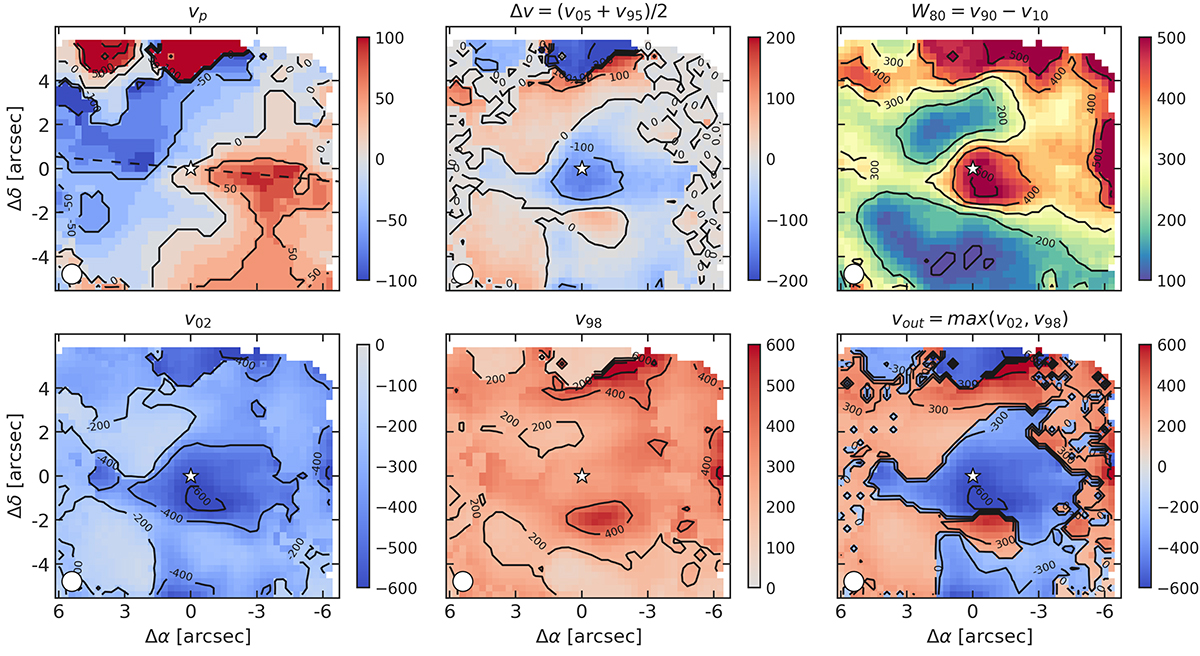
Fig. 13.
Download original image
Non-parametric velocity components for the [OIII] line. The top panels show, from left to right, the peak velocity vp, the broad velocity Δv, and the 80% width W80. The bottom panels show, from left to right, the velocity at the 2nd flux percentile (v02), at the 98th (v98), and the positive or negative velocities that have the maximum absolute value between these two (for every spaxel), which is our estimate for the outflow velocity vout. The white star symbol marks the AGN position, and the dashed black line in the top-left panel is the kinematic major axis (PA = 265°). The white circle in the bottom left of each panel is the MEGARA seeing conditions. Velocities in all the panels are in km s−1.
Current usage metrics show cumulative count of Article Views (full-text article views including HTML views, PDF and ePub downloads, according to the available data) and Abstracts Views on Vision4Press platform.
Data correspond to usage on the plateform after 2015. The current usage metrics is available 48-96 hours after online publication and is updated daily on week days.
Initial download of the metrics may take a while.