Fig. 12.
Download original image
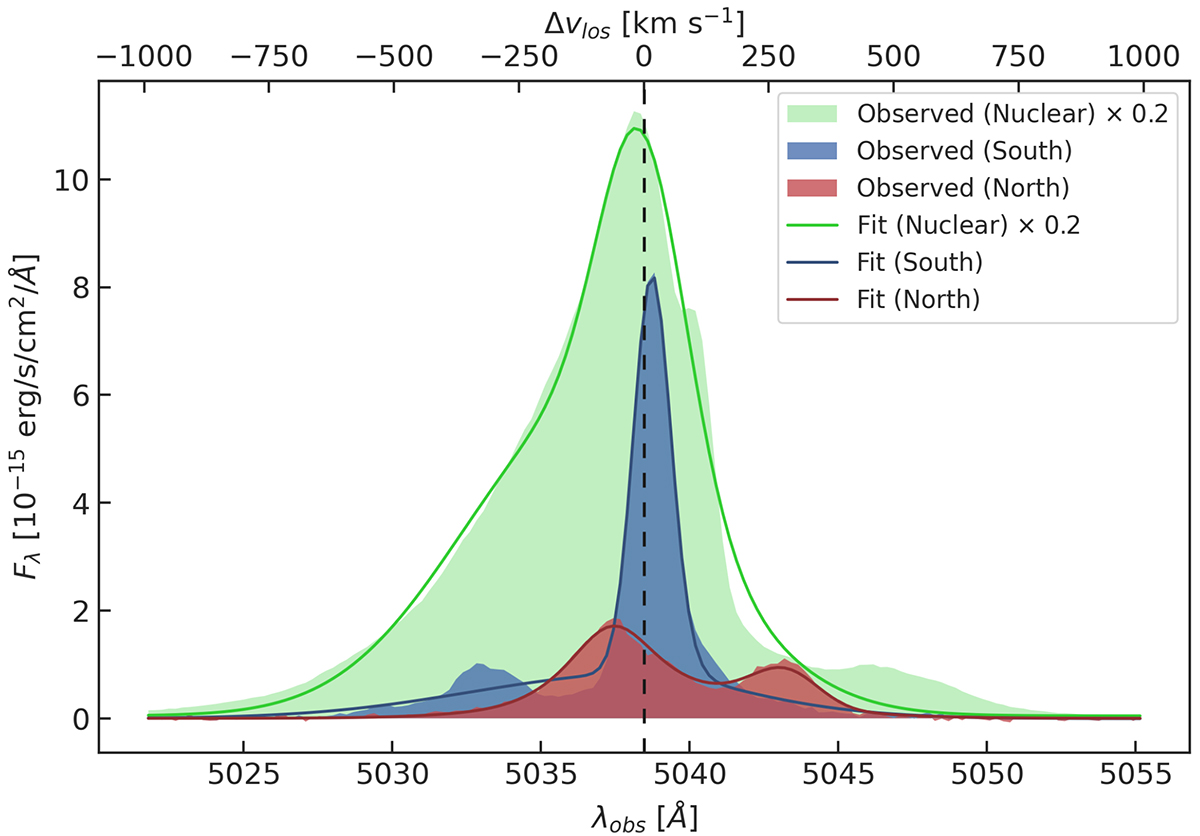
Observed spectra (continuum-subtracted) of the [OIII]λ5007 line at three locations along the kinematical minor axis (PA = 355°). In green, blue, and red shadings, the spectra extracted within the nuclear region (black square in Fig. 2), the southern region, and the northern region (black rectangles in Fig. 10), respectively. With the same colours, the lines are the ALUCINE two-component fits for the same regions. Note that for the nuclear and southern regions a third component would be needed to fit the residual blueshifted and redshifted components, respectively. The nuclear spectrum is multiplied by a 0.2 factor for a better comparison. The vertical dashed line is the redshifted (with ![]() km s−1) [OIII] line.
km s−1) [OIII] line.
Current usage metrics show cumulative count of Article Views (full-text article views including HTML views, PDF and ePub downloads, according to the available data) and Abstracts Views on Vision4Press platform.
Data correspond to usage on the plateform after 2015. The current usage metrics is available 48-96 hours after online publication and is updated daily on week days.
Initial download of the metrics may take a while.