Fig. 11.
Download original image
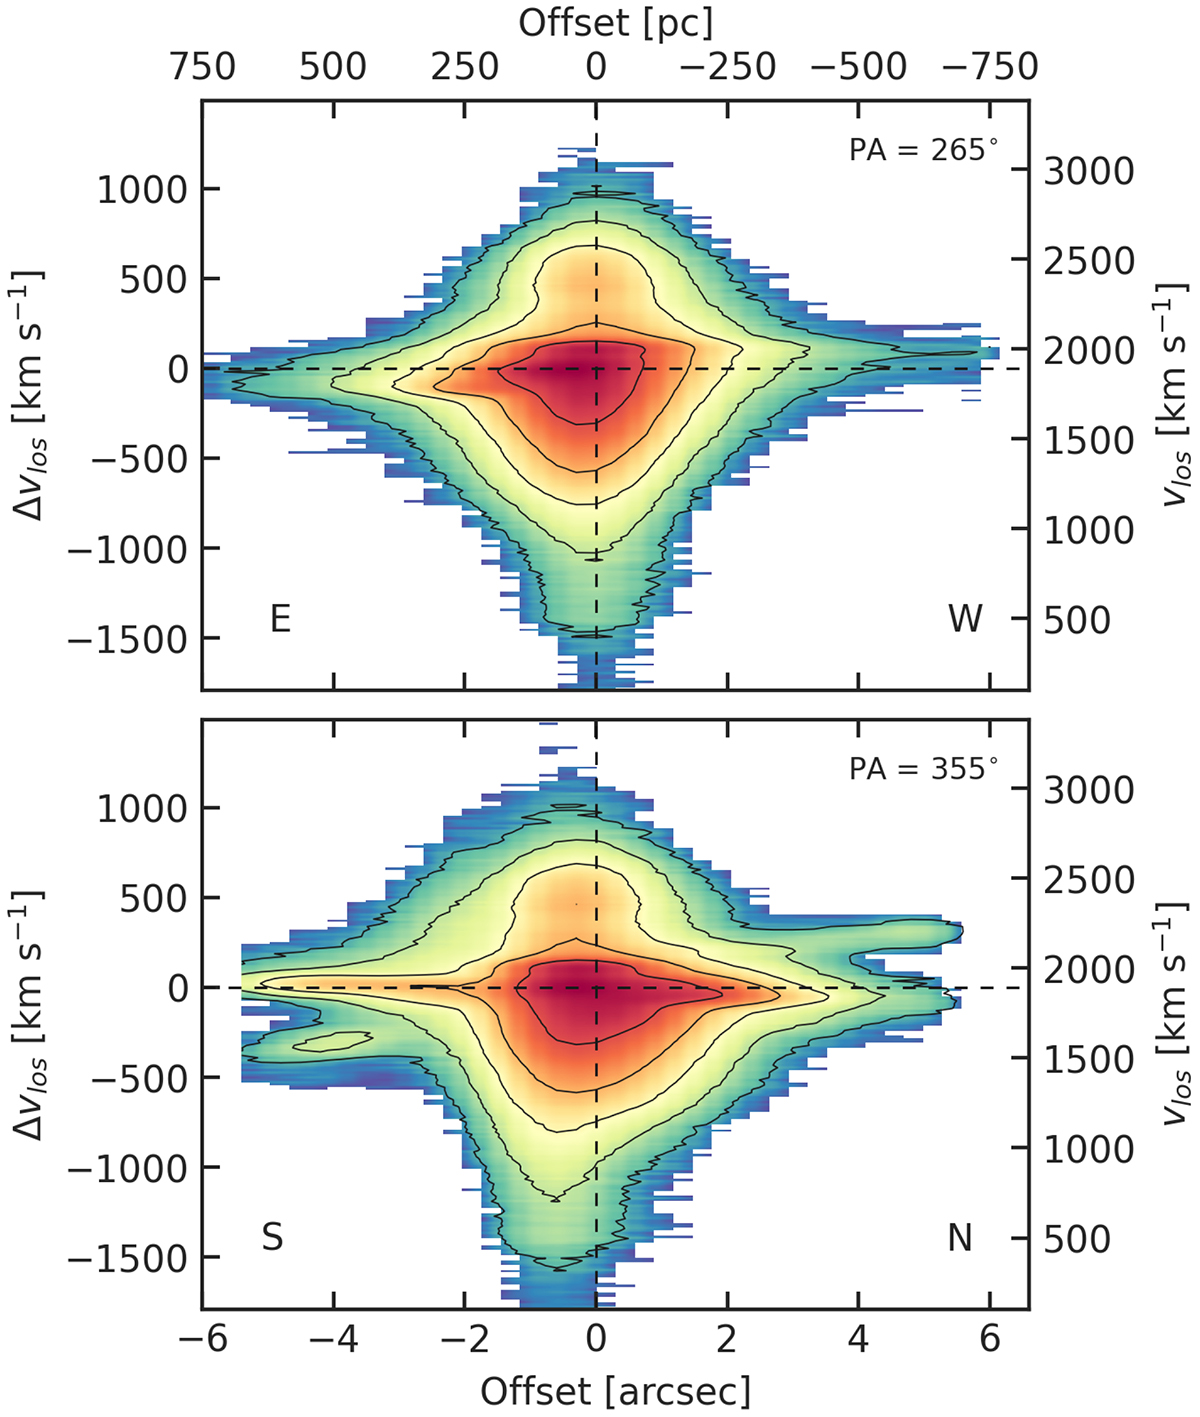
PV diagrams of the observed [OIII] (λe = 5007 Å) line, clipped at 3σ, along major (top panel) and minor (bottom panel) kinematic axes, with PA = 265° and 355°, respectively. Contours are at [10, 30, 100, 300, 1000]σ. The vertical dashed line is the AGN position, and the horizontal dashed line is the systemic velocity ![]() km s−1. The approximate eastern, western, southern, and northern directions are marked in the panels. At Δvlos < −1500 km s−1 contamination with the secondary [OIII] line (λe = 4959 Å) is probable.
km s−1. The approximate eastern, western, southern, and northern directions are marked in the panels. At Δvlos < −1500 km s−1 contamination with the secondary [OIII] line (λe = 4959 Å) is probable.
Current usage metrics show cumulative count of Article Views (full-text article views including HTML views, PDF and ePub downloads, according to the available data) and Abstracts Views on Vision4Press platform.
Data correspond to usage on the plateform after 2015. The current usage metrics is available 48-96 hours after online publication and is updated daily on week days.
Initial download of the metrics may take a while.