Fig. 1.
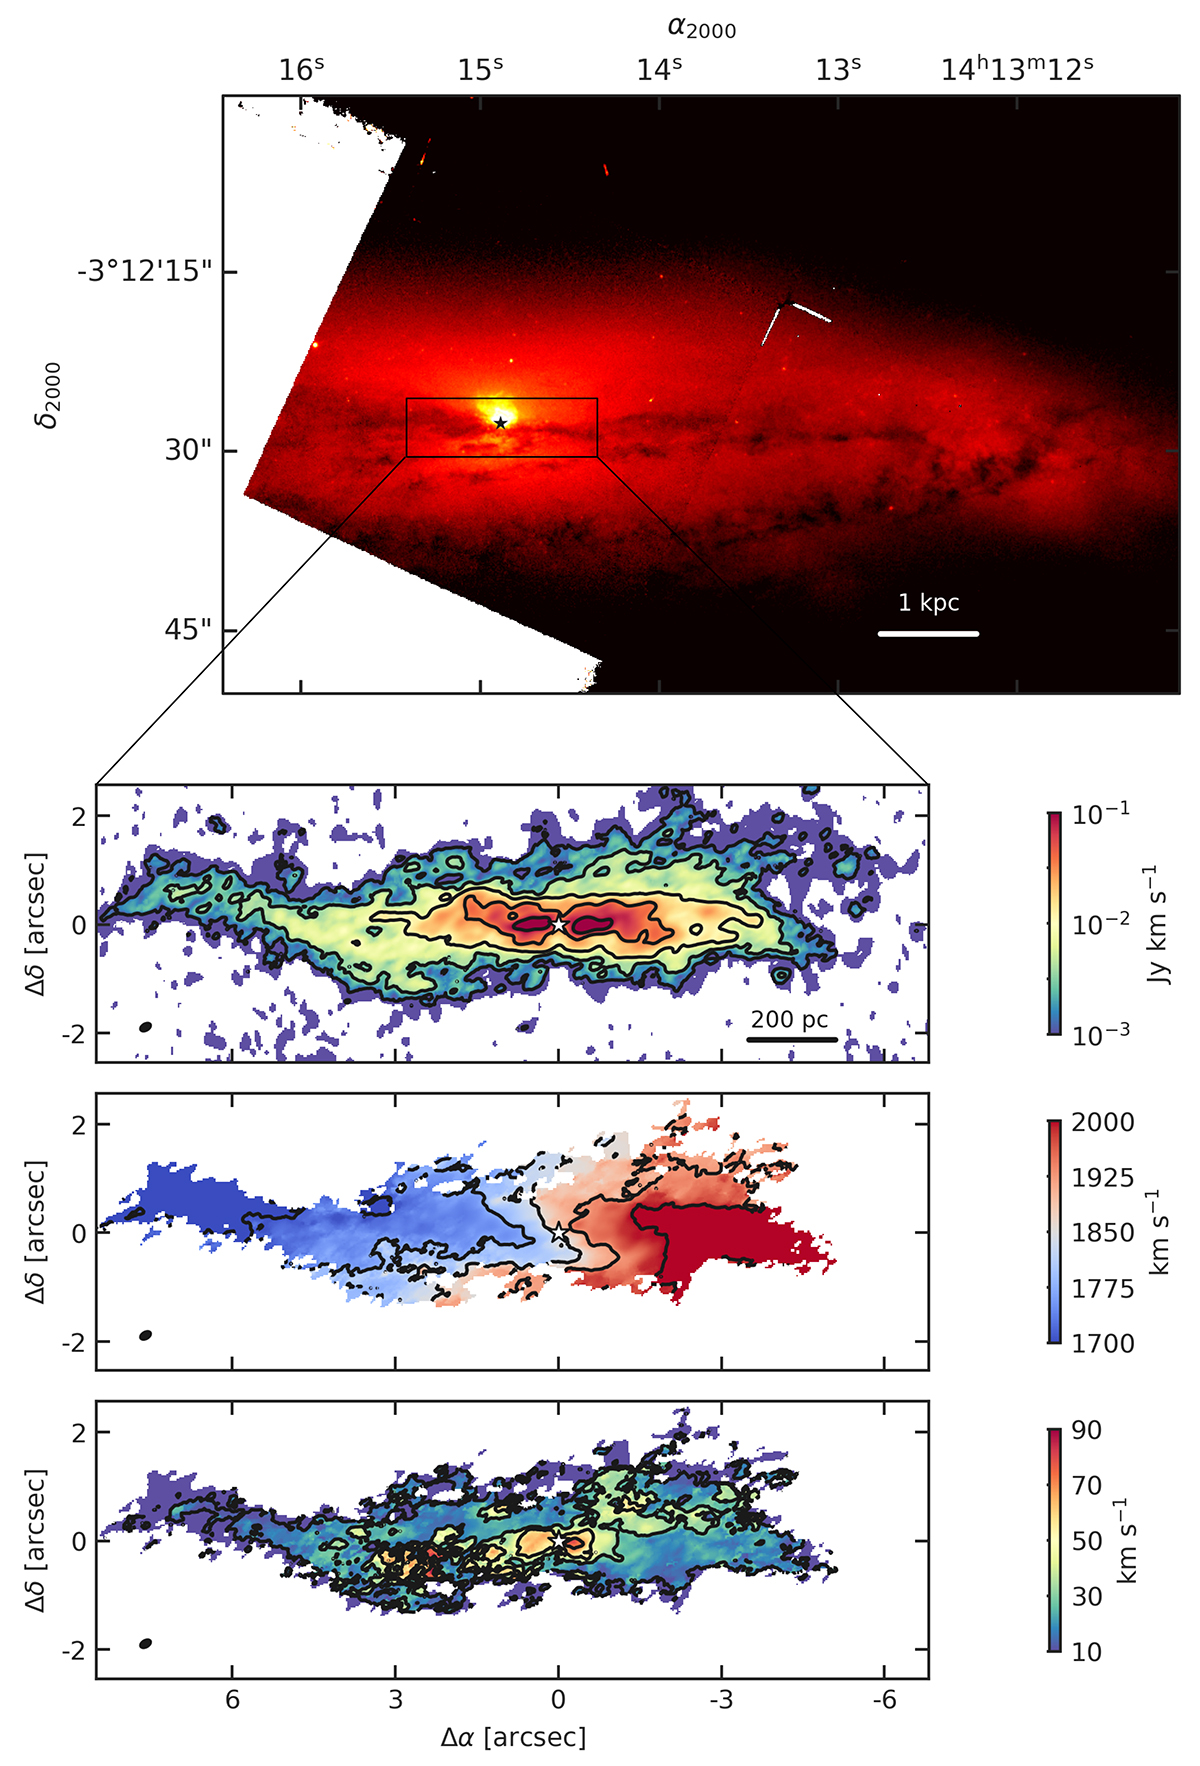
Download original image
Optical and molecular views of NGC 5506. Top: HST/F606W image of NGC 5506 from Malkan et al. (1998). The black rectangle identifies a region of 15.3″ × 5.1″ (corresponding to 1.9 × 0.6 kpc2). Bottom: ALMA CO(3 − 2) intensity, velocity and velocity dispersion maps, clipped at a signal-to-noise ratio of 3. The contours are between 10−3 and 10−1 Jy km s−1 (with 0.5 dex steps) for the intensity map, between 1700 and 2000 km s−1 (with 75 km s−1 steps) for the velocity map, and between 10 and 90 km s−1 (with 20 km s−1 steps) for the velocity dispersion map. North is up and east is left, and offsets in the ALMA maps are measured relative to the 870 μm continuum peak (as in García-Burillo et al. 2021), marked with a star symbol in every panel. The ALMA beam (0.21″ × 0.13″) appears in every bottom panel as a black ellipse in the lower left.
Current usage metrics show cumulative count of Article Views (full-text article views including HTML views, PDF and ePub downloads, according to the available data) and Abstracts Views on Vision4Press platform.
Data correspond to usage on the plateform after 2015. The current usage metrics is available 48-96 hours after online publication and is updated daily on week days.
Initial download of the metrics may take a while.