Fig. 11
Download original image
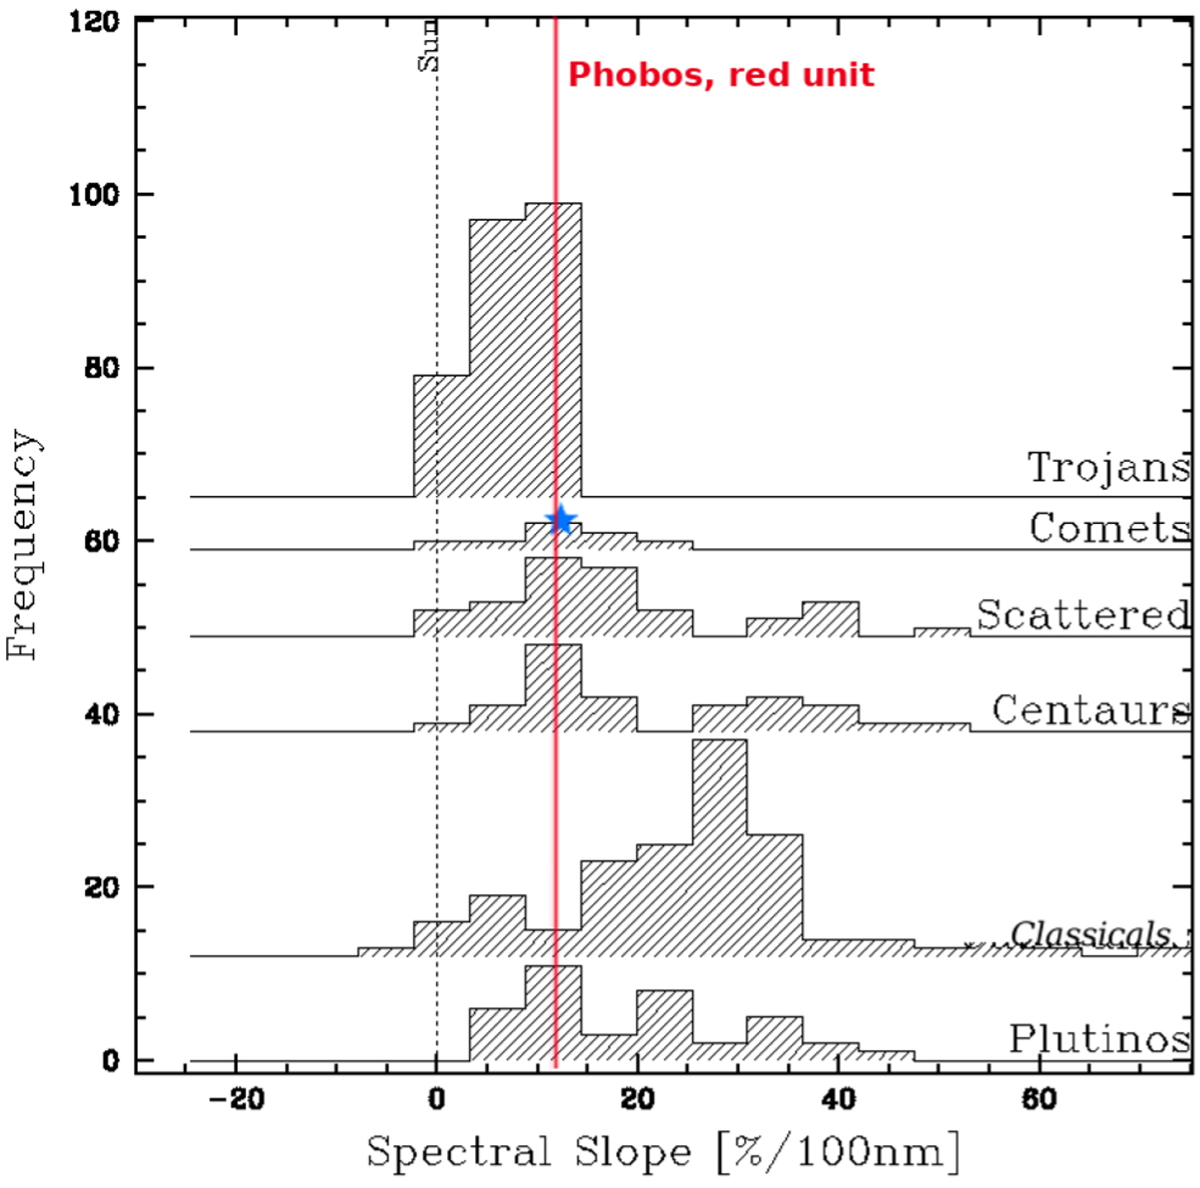
Spectral gradient, estimated in the 550–800 nm range, of Phobos’ red unit (11%/(100 nm); red vertical line) derived from spectra presented in Fraeman et al. (2012) compared to the values reported by Fornasier et al. (2007) for cometary nuclei, Jupiter Trojans, and the different dynamical classes of the transneptunian population. Frequency refers to the number of objects in the different histograms. The figure was adapted from Fornasier et al. (2007). The blue star indicates the spectral slope of comet 67P determined at phase 1.3º (12.6%/(100 nm)) and at a heliocentric distance of 3.6 au by Fornasier et al. (2015).
Current usage metrics show cumulative count of Article Views (full-text article views including HTML views, PDF and ePub downloads, according to the available data) and Abstracts Views on Vision4Press platform.
Data correspond to usage on the plateform after 2015. The current usage metrics is available 48-96 hours after online publication and is updated daily on week days.
Initial download of the metrics may take a while.