Open Access
Fig. 9.
Download original image
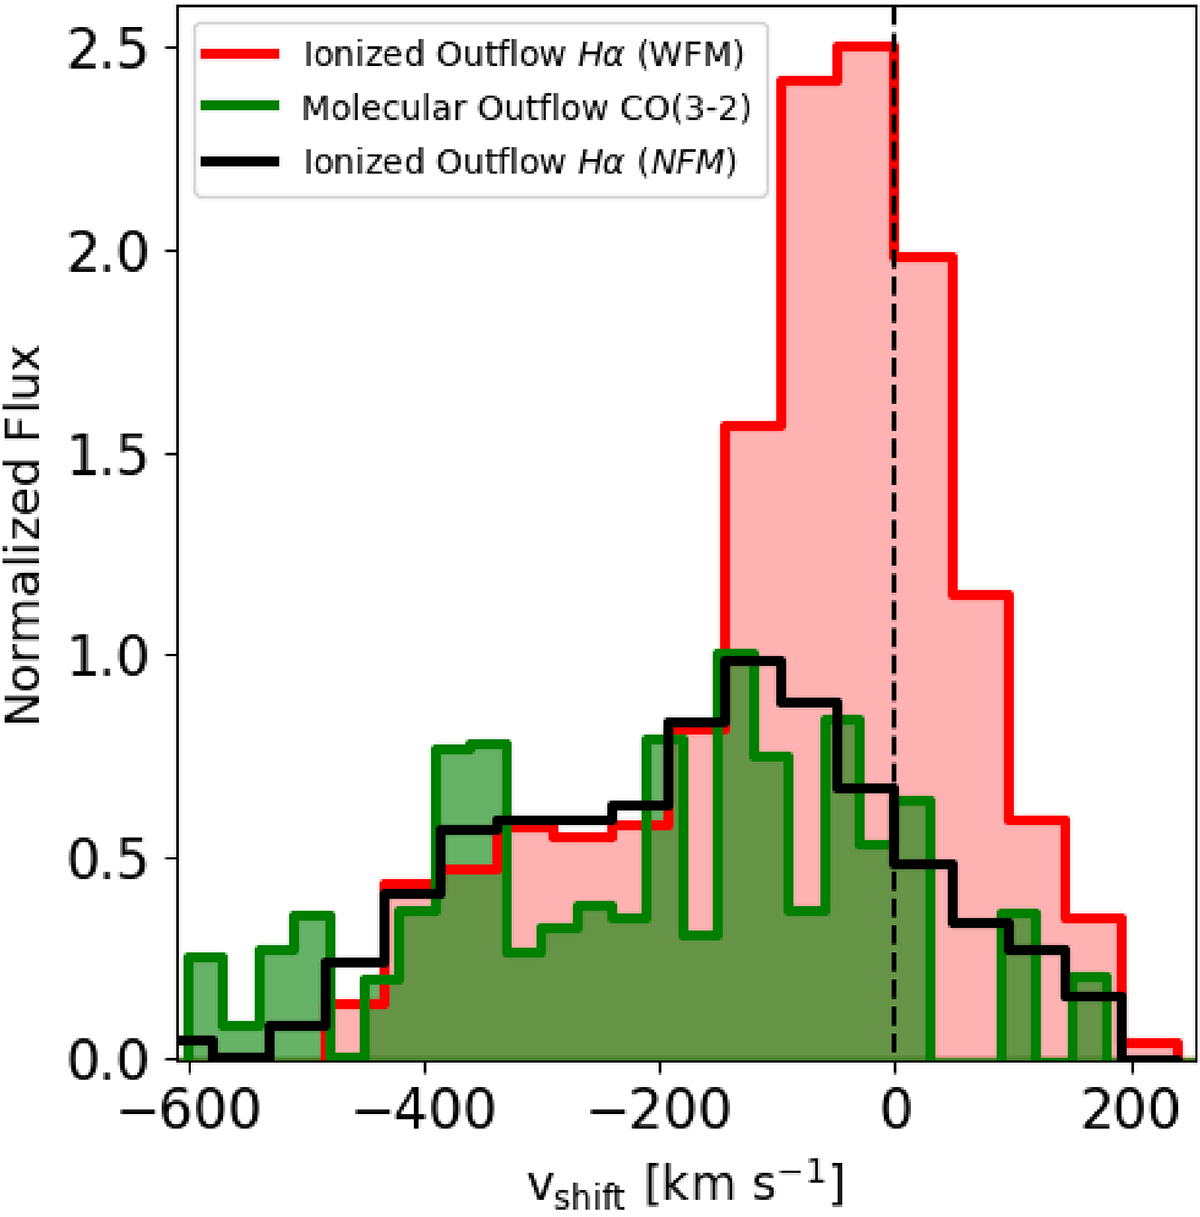
Spectra extracted from nuclear- and continuum-subtracted MUSE WFM (red; Hα) and NFM (black; Hα) datacubes, and from the ALMA data (green; CO (3–2)), in the region where the Hα outflow is observed in NFM MUSE data.
Current usage metrics show cumulative count of Article Views (full-text article views including HTML views, PDF and ePub downloads, according to the available data) and Abstracts Views on Vision4Press platform.
Data correspond to usage on the plateform after 2015. The current usage metrics is available 48-96 hours after online publication and is updated daily on week days.
Initial download of the metrics may take a while.