Fig. 8.
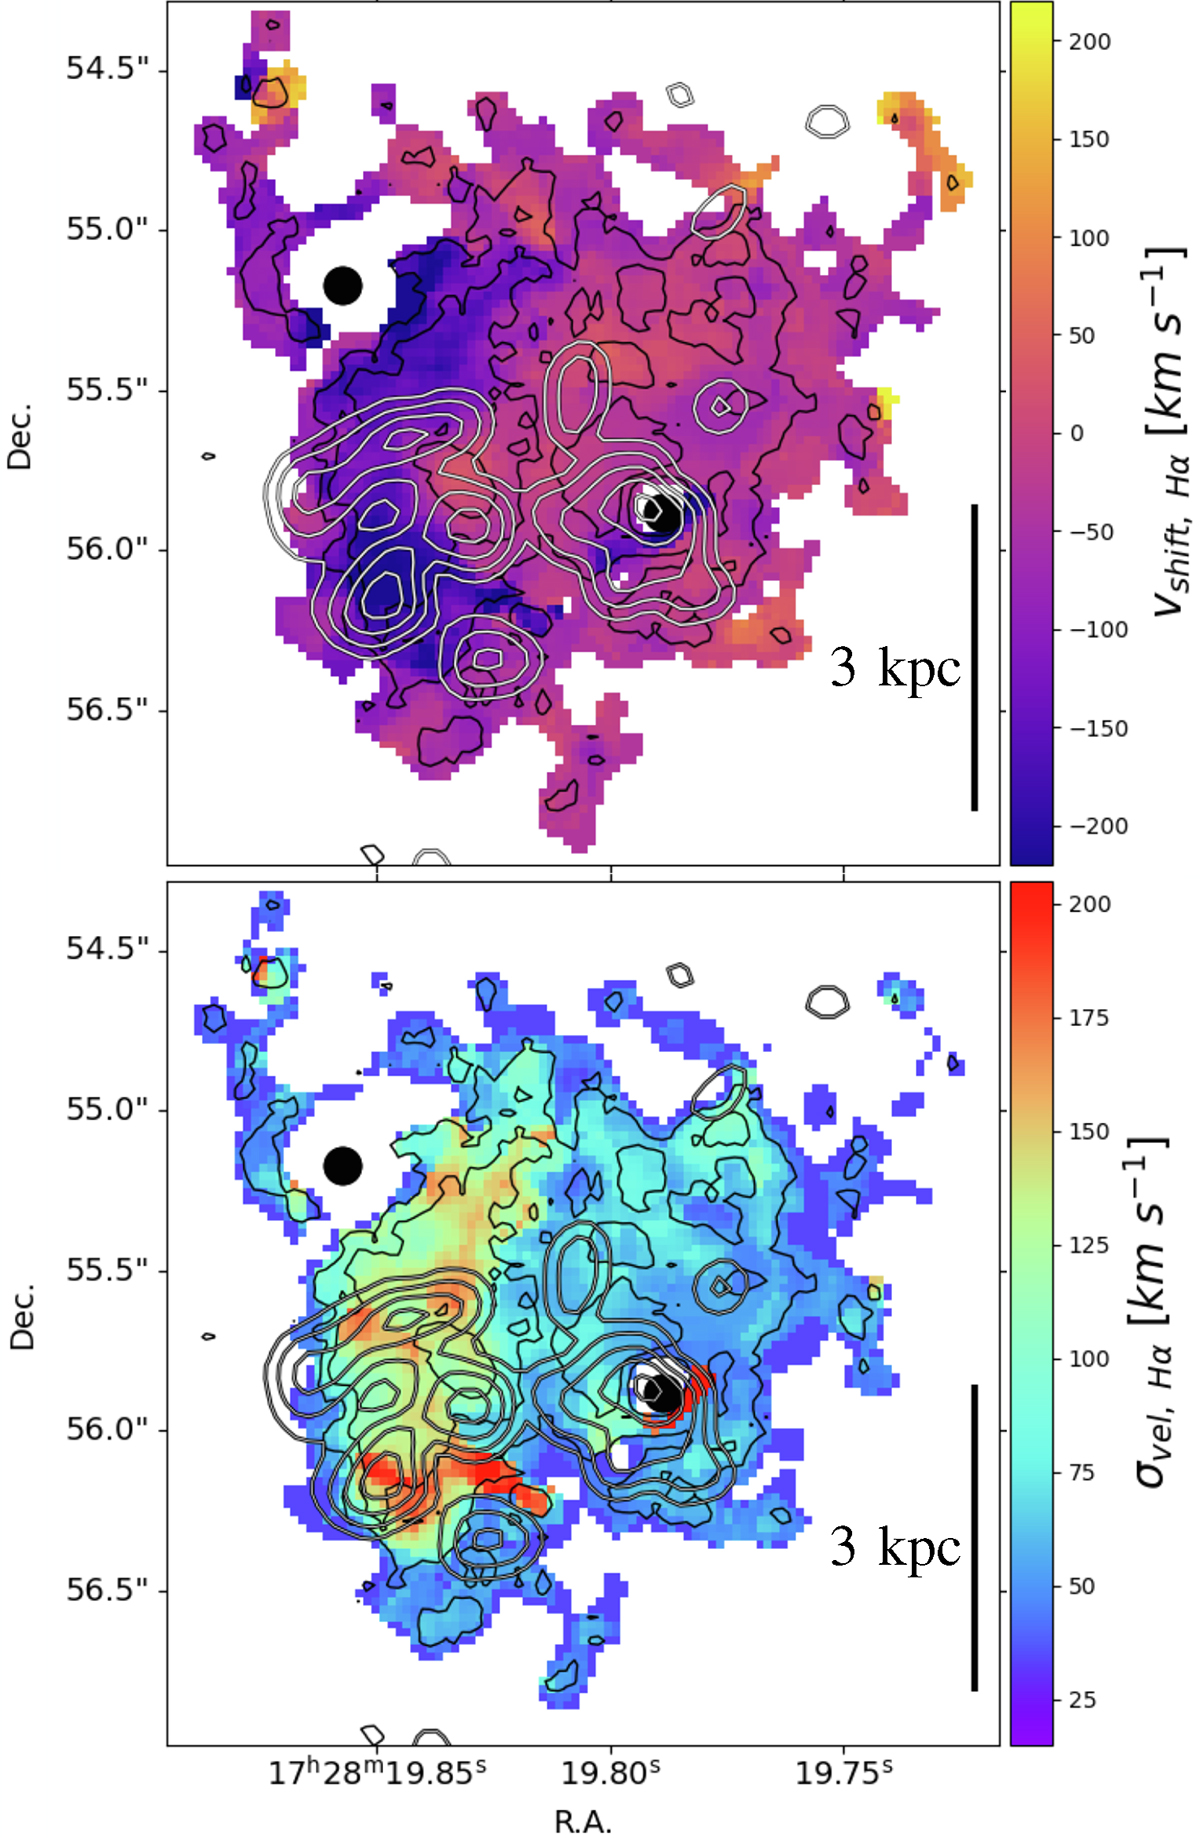
Download original image
First (top) and second (bottom) moment of the flux distribution of the Hα emission obtained with the Cube2Im function in CubExtractor, representing the vshift and σvel maps. The gray contours show the morphology of the extended (up to ≈5 kpc) blueshifted CO (3–2) molecular outflow, detected by B19, at the emission levels of 1, 4, 8, and 10 mJy. The black circles and contours are the same as in Fig. 7.
Current usage metrics show cumulative count of Article Views (full-text article views including HTML views, PDF and ePub downloads, according to the available data) and Abstracts Views on Vision4Press platform.
Data correspond to usage on the plateform after 2015. The current usage metrics is available 48-96 hours after online publication and is updated daily on week days.
Initial download of the metrics may take a while.