Fig. 7.
Download original image
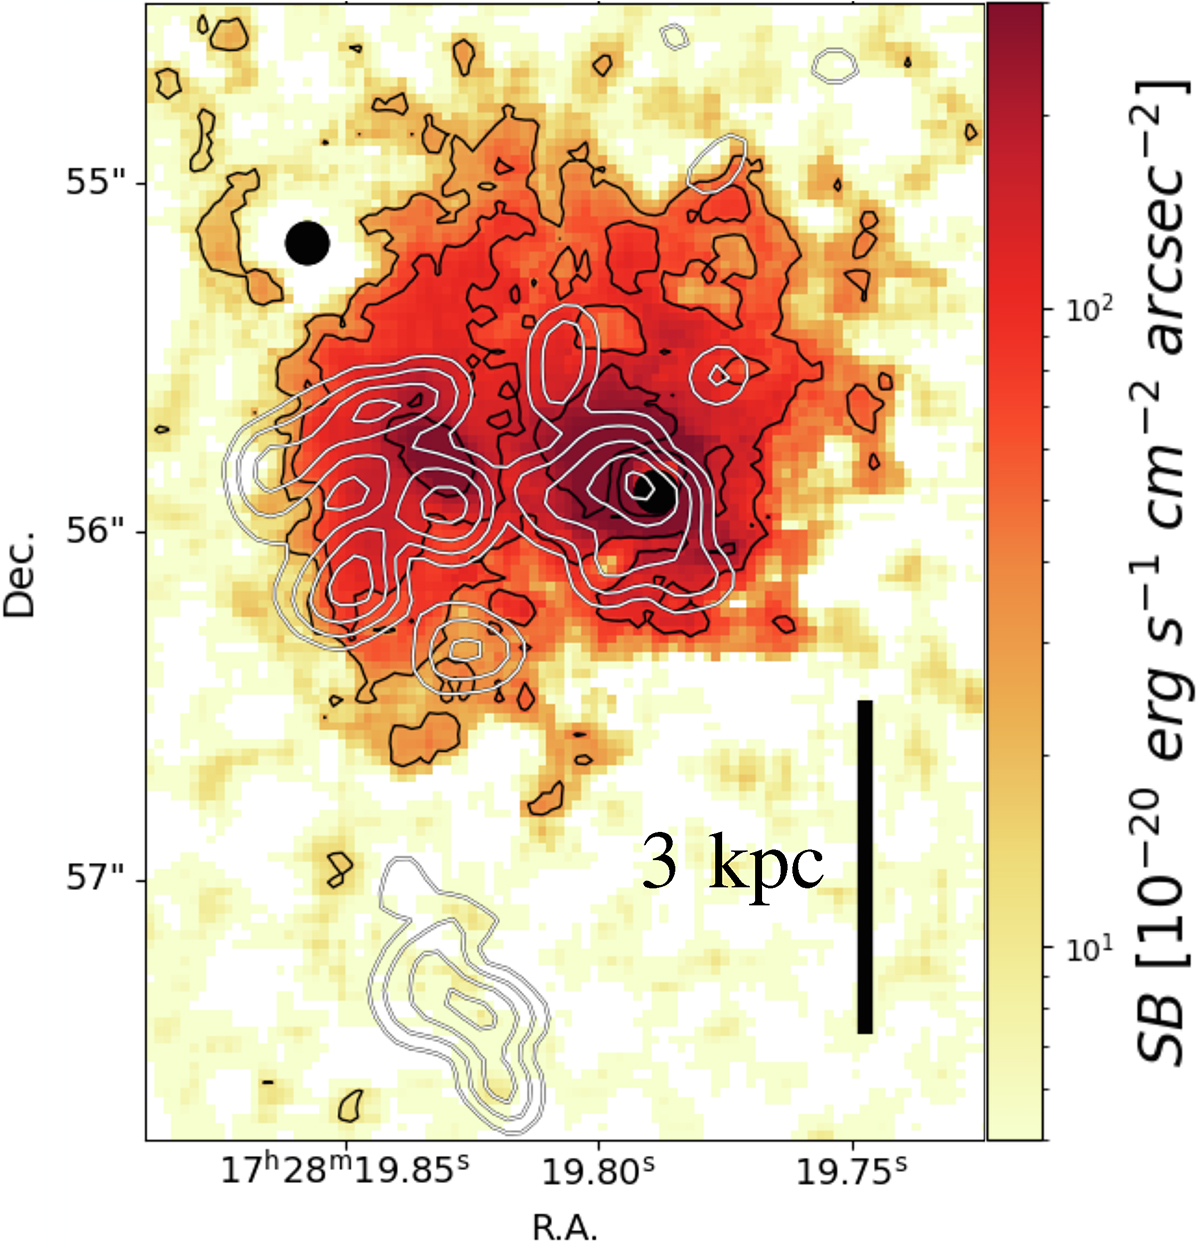
MUSE NFM surface brightness map of the Hα emission. The black contours show the S/N levels of the Hα emission of 3, 5, and 10. The gray contours show the morphology of the blueshifted CO (3–2) molecular outflow (B19), at the emission levels of 1, 4, 8, and 10 mJy. The black circles indicate regions affected by significant residuals in the PSF subtraction due to the quasar and a nearby continuum source.
Current usage metrics show cumulative count of Article Views (full-text article views including HTML views, PDF and ePub downloads, according to the available data) and Abstracts Views on Vision4Press platform.
Data correspond to usage on the plateform after 2015. The current usage metrics is available 48-96 hours after online publication and is updated daily on week days.
Initial download of the metrics may take a while.