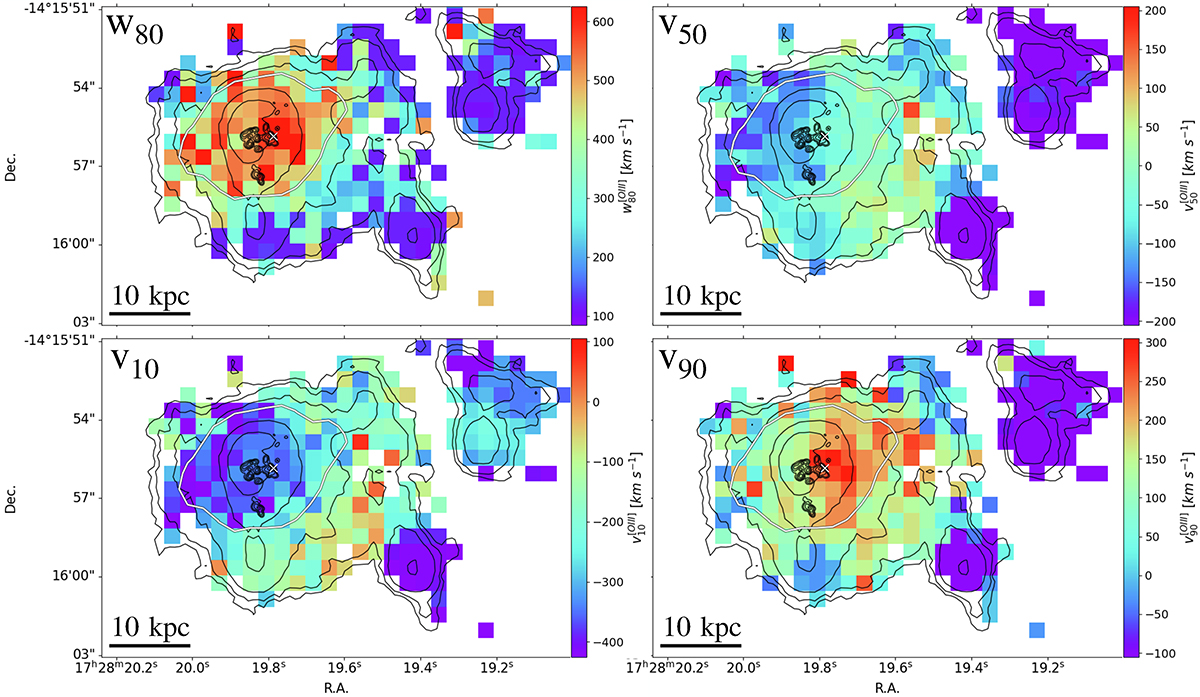
Fig. 6.
Download original image
Maps of w80 (top left), v50 (top right), v10 (bottom left), and v90 (bottom right) of the [O III] emission line. These maps provide an overview of the widths and velocity shifts from the entire [O III] profile. In each panel, the black thin contours represent the S/N levels shown in Fig. 4. The black thick contours in the center of the figure depict the molecular outflow, detected in B19. These contours correspond to the emission levels of 1, 4, 8, and 10 mJy. The white cross gives the position of the quasar. The white lines in each map represent 2σ Gaussian-smoothed contours that enclose the regions where w80 exceeds 400 km s−1.
Current usage metrics show cumulative count of Article Views (full-text article views including HTML views, PDF and ePub downloads, according to the available data) and Abstracts Views on Vision4Press platform.
Data correspond to usage on the plateform after 2015. The current usage metrics is available 48-96 hours after online publication and is updated daily on week days.
Initial download of the metrics may take a while.