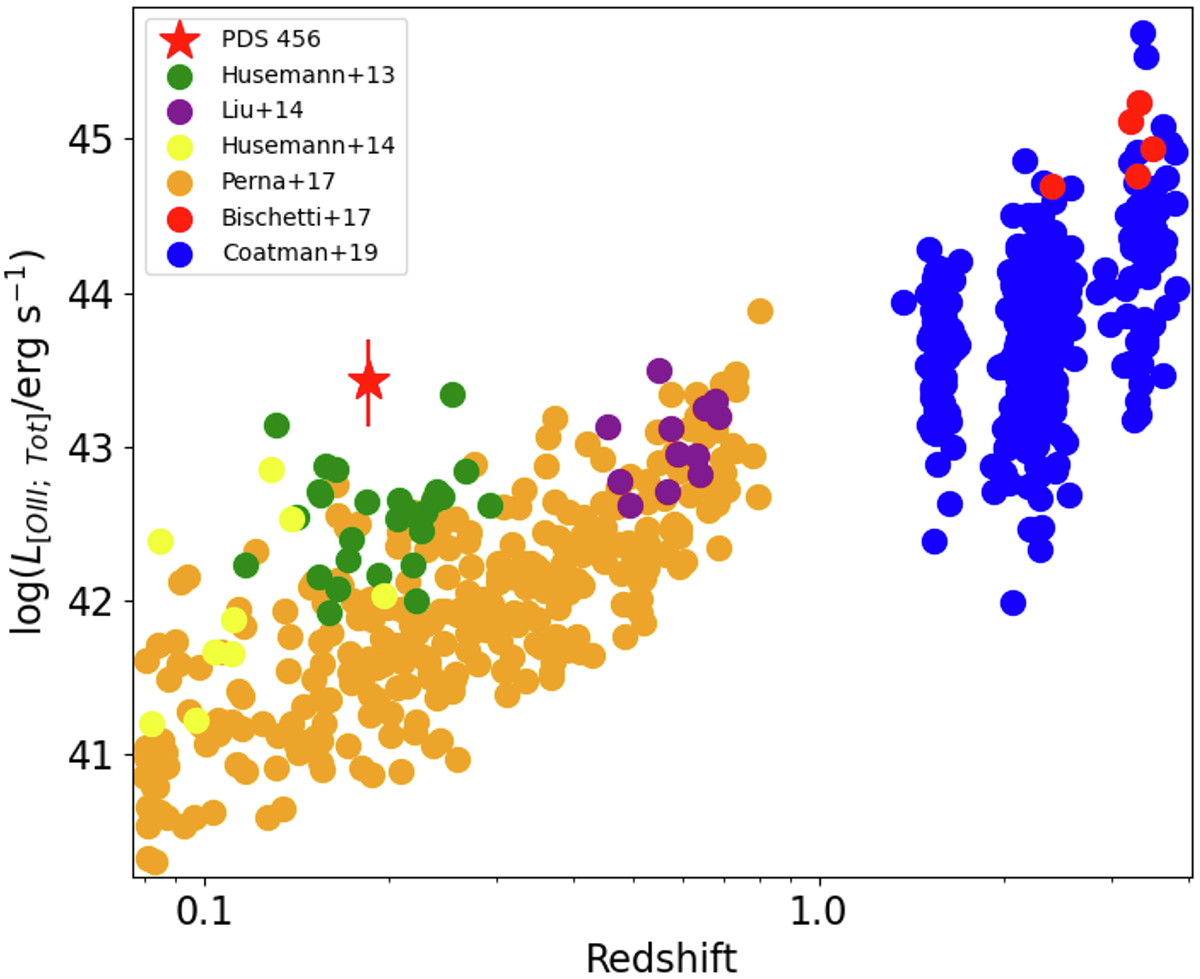
Fig. 5.
Download original image
Total observed [O III] luminosity (L[O III]) of PDS 456 (red star) compared with that measured for other samples of Type 1 quasars in the redshift range z ∼ 0.1 to ∼4. The quasars at z < 1 are from Husemann et al. (2013; green dots), Husemann et al. (2014; yellow dots), Liu et al. (2014; purple dots), and Perna et al. (2017; orange dots). Quasars at z > 1 are from Coatman et al. (2019; blue dots) and Bischetti et al. (2017; red dots).
Current usage metrics show cumulative count of Article Views (full-text article views including HTML views, PDF and ePub downloads, according to the available data) and Abstracts Views on Vision4Press platform.
Data correspond to usage on the plateform after 2015. The current usage metrics is available 48-96 hours after online publication and is updated daily on week days.
Initial download of the metrics may take a while.