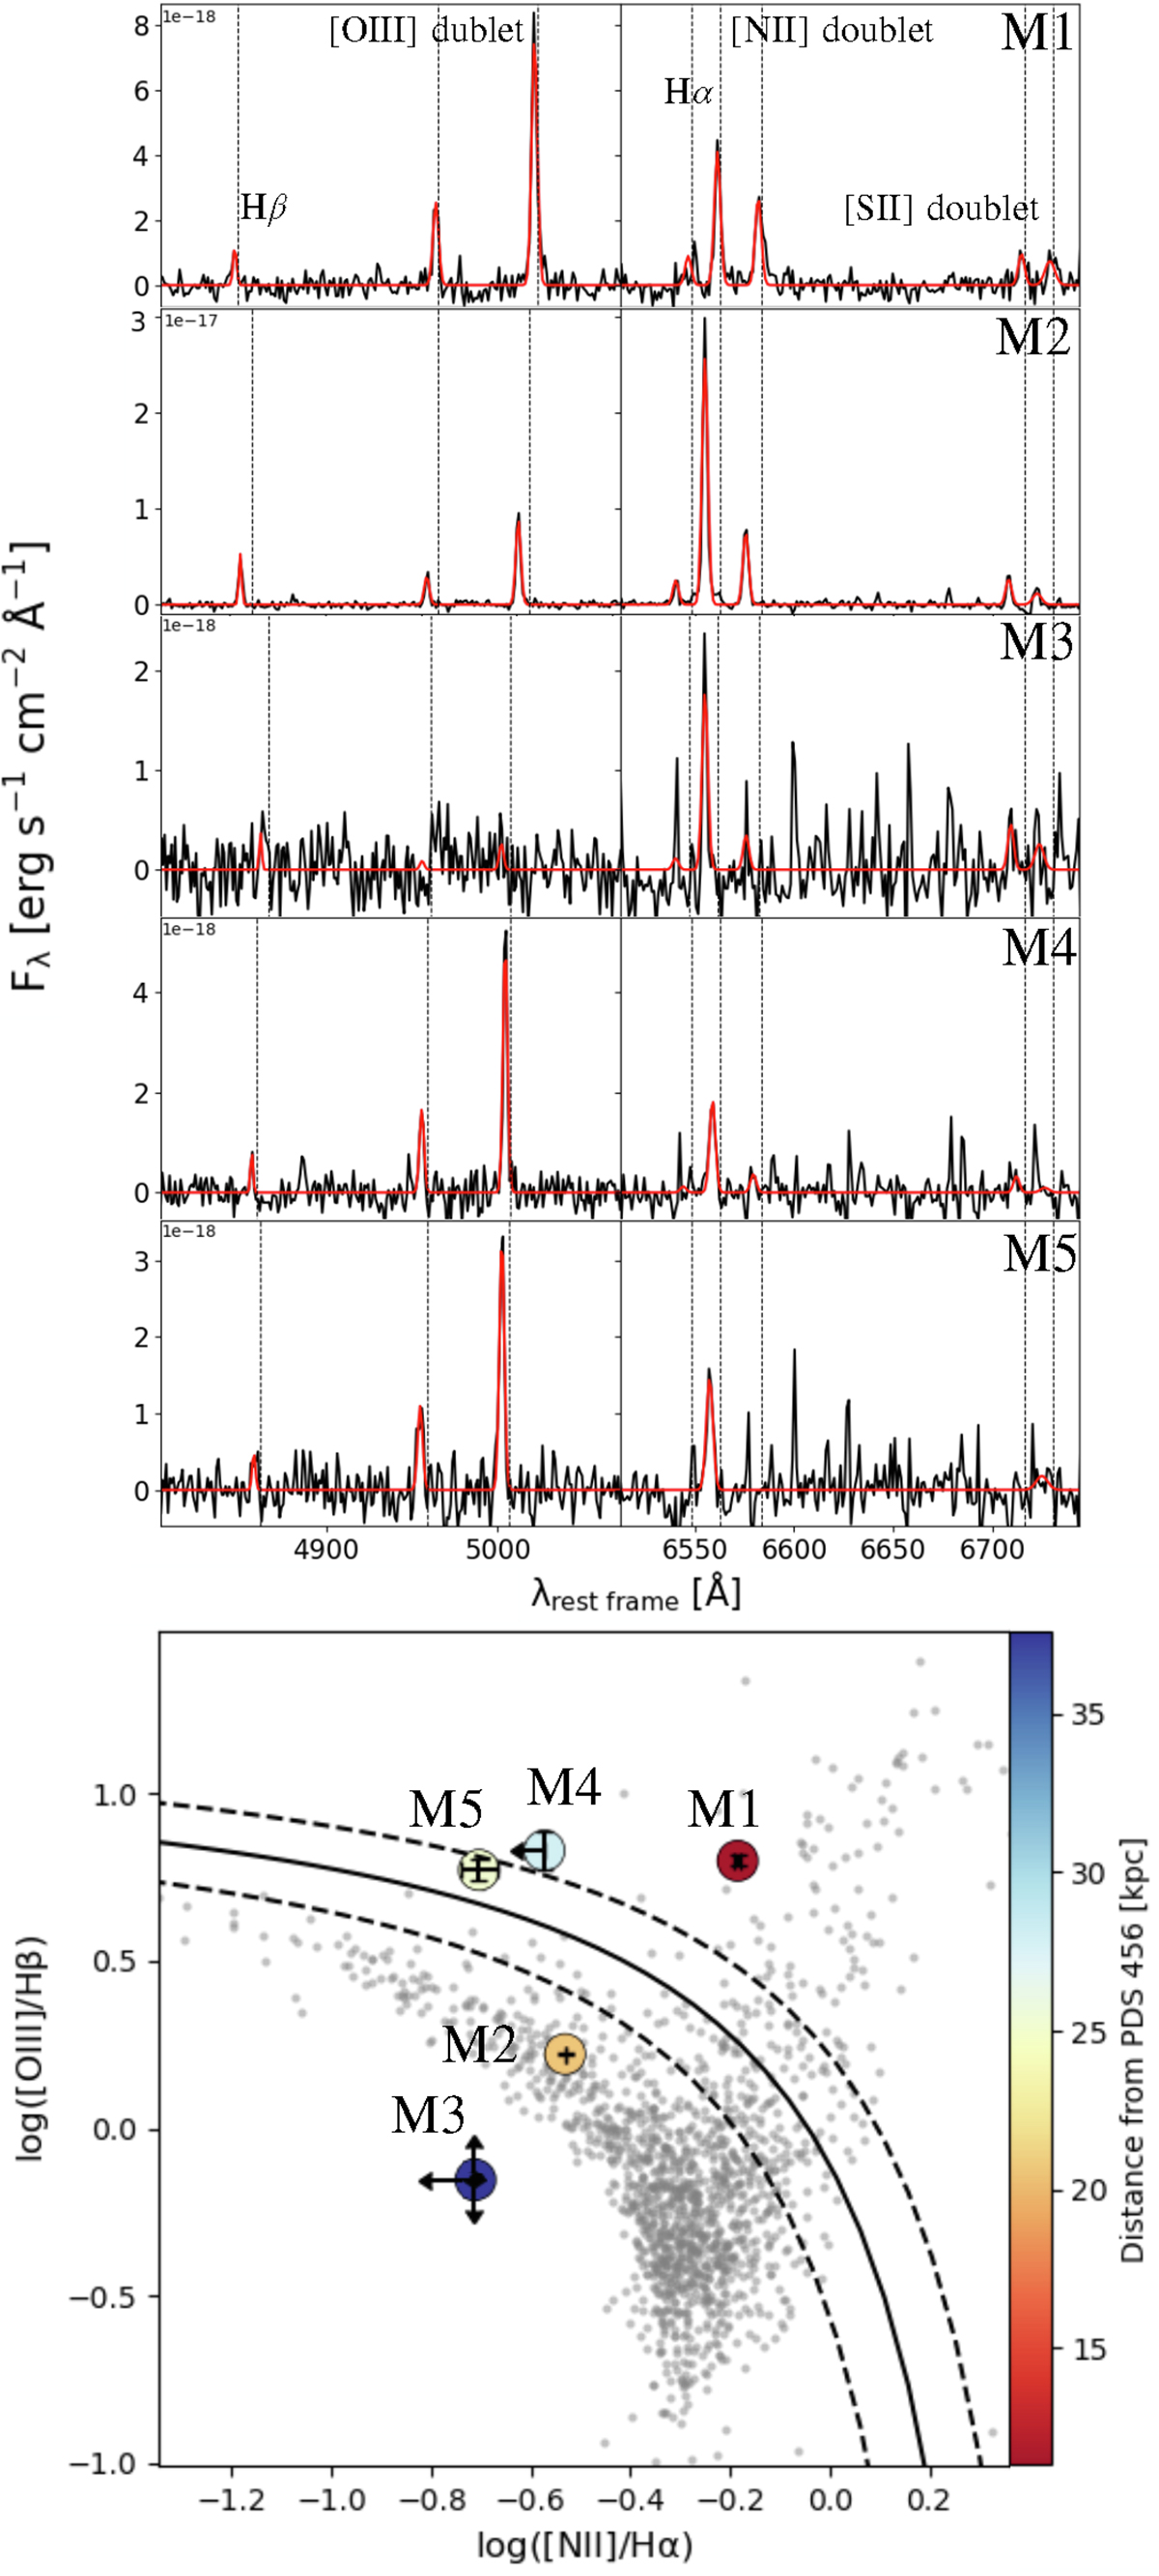
Fig. 3.
Download original image
BPT diagram derived from spectral fit results for galaxy companions of PDS 456. The top panel displays the spectra and their best-fit models, while the bottom panel presents the [N II] -BPT diagram, for the galaxy companions of PDS 456. These spectra were extracted from circular regions with a radius of 2 pixels in the datacube, where the nuclear and continuum emission components of PDS 456 have been subtracted. The transparent gray dots show the values from the SDSS survey (credits: Jake Vanderplas & AstroML Developers). The black lines dividing different types of emissions in the BPT diagram are from Kewley et al. (2001).
Current usage metrics show cumulative count of Article Views (full-text article views including HTML views, PDF and ePub downloads, according to the available data) and Abstracts Views on Vision4Press platform.
Data correspond to usage on the plateform after 2015. The current usage metrics is available 48-96 hours after online publication and is updated daily on week days.
Initial download of the metrics may take a while.