Open Access
Fig. A.1.
Download original image
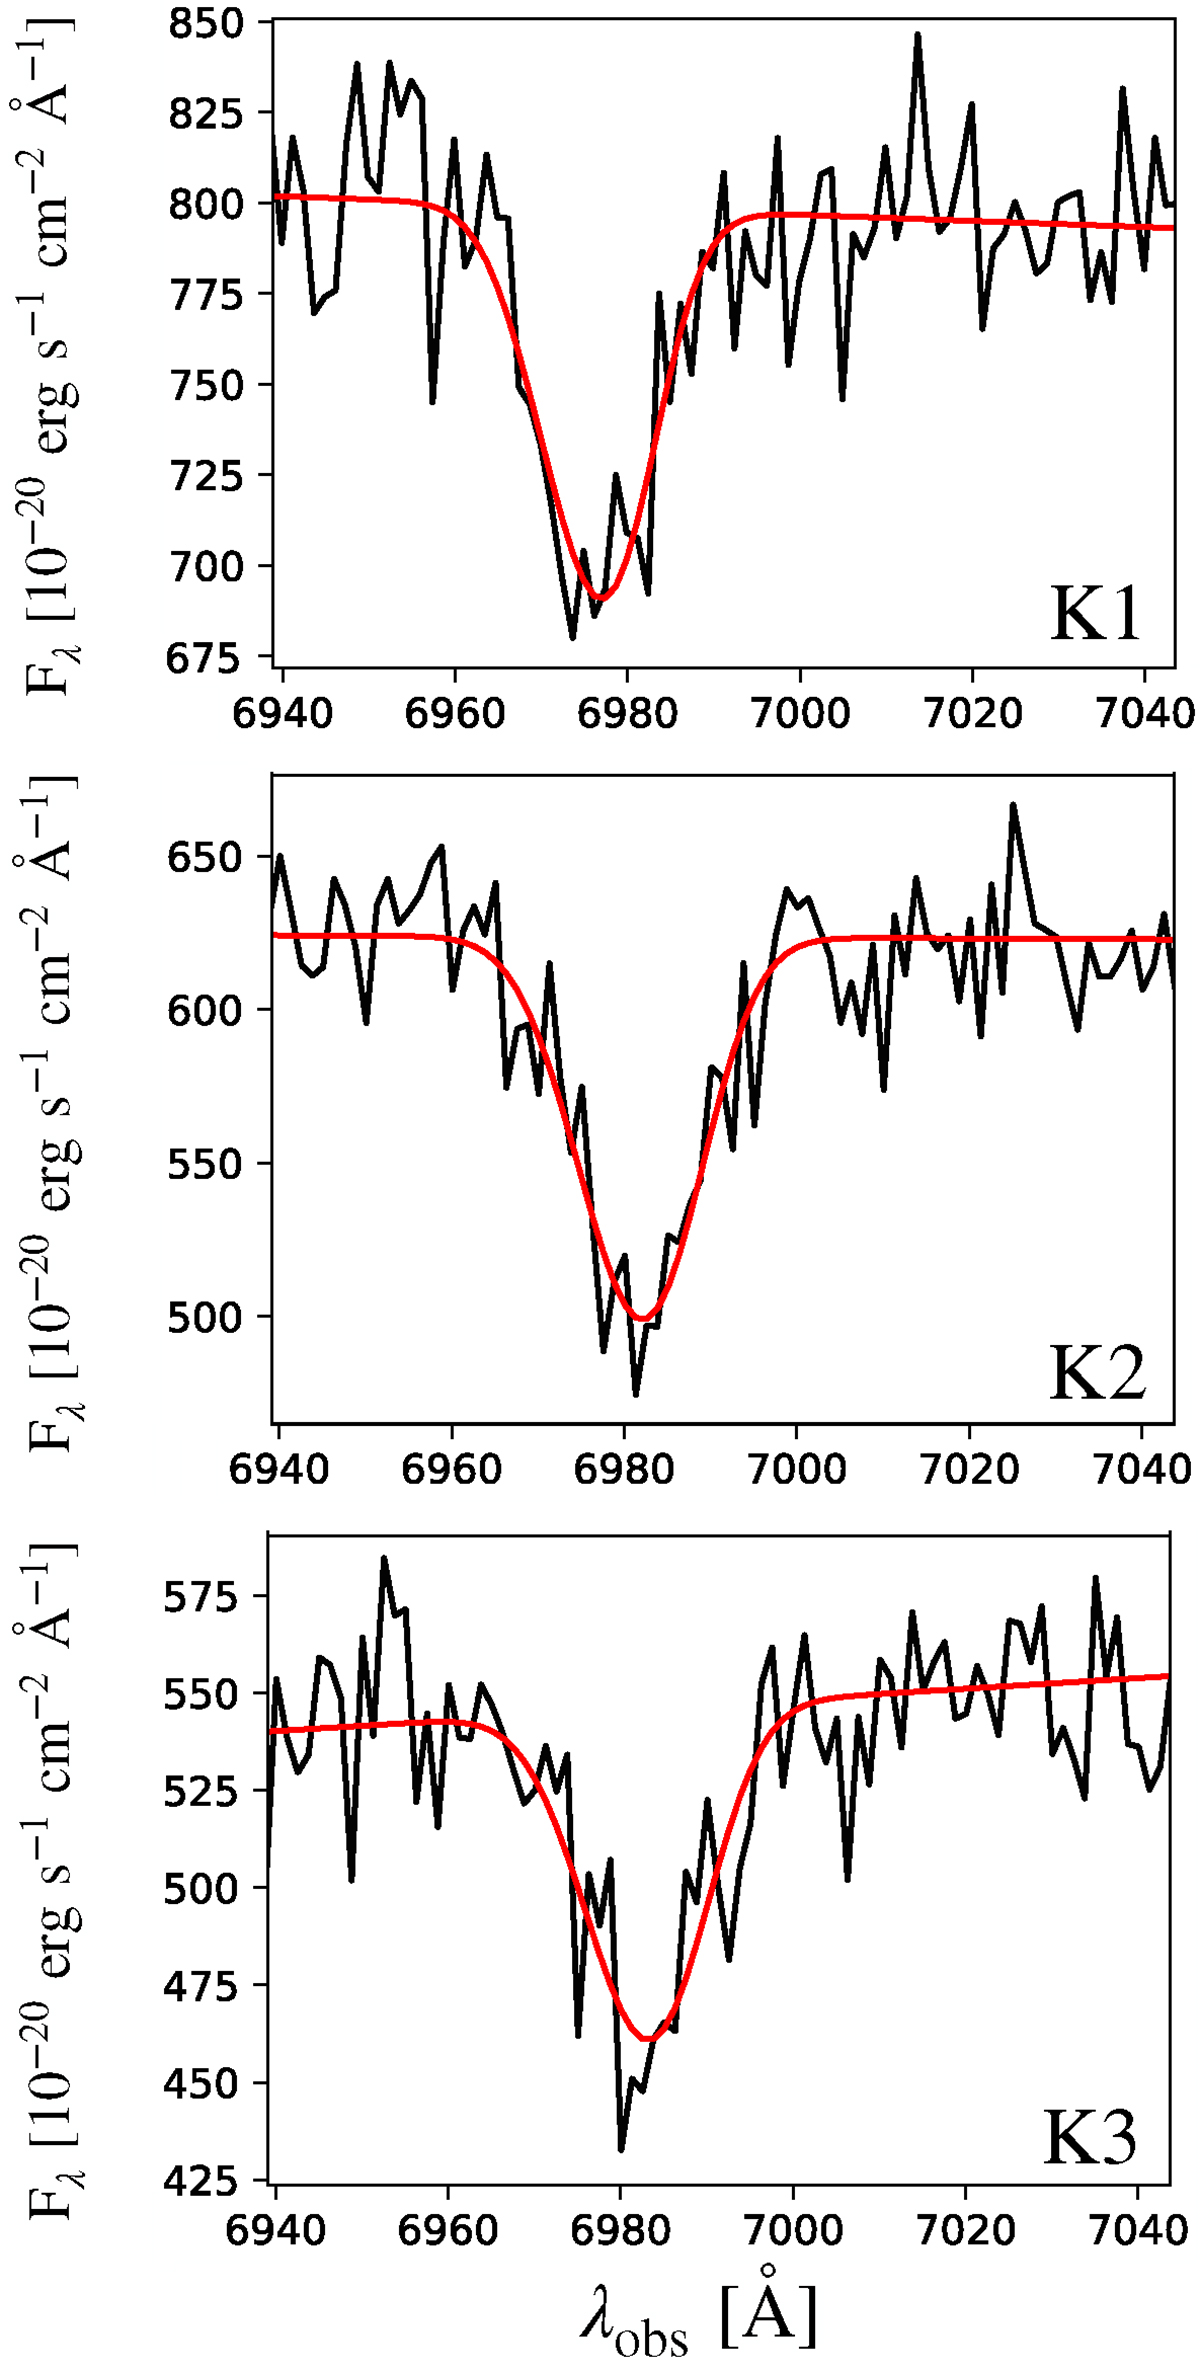
Spectra extracted from 2 pixel radius circles centered on the sources K1, K2, and K3, zoomed in on the NaID absorption line. The red line in each panel is the best-fit model of the NaID absorption features.
Current usage metrics show cumulative count of Article Views (full-text article views including HTML views, PDF and ePub downloads, according to the available data) and Abstracts Views on Vision4Press platform.
Data correspond to usage on the plateform after 2015. The current usage metrics is available 48-96 hours after online publication and is updated daily on week days.
Initial download of the metrics may take a while.