Fig. 12.
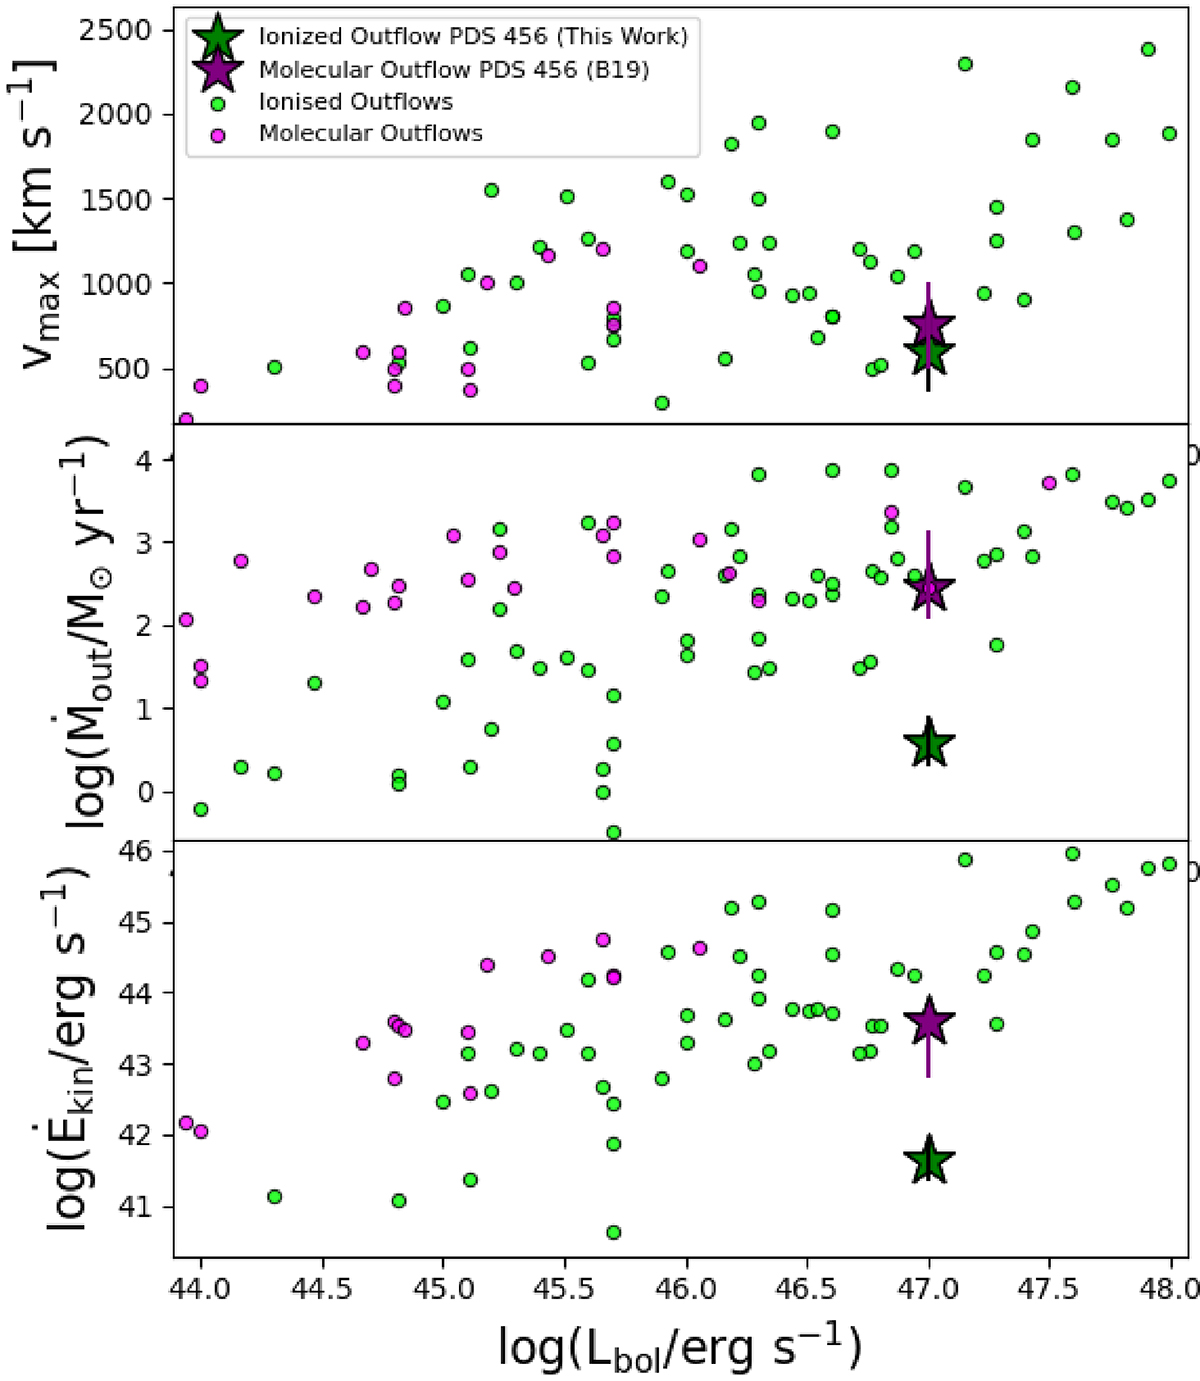
Download original image
vmax (top panel), Ṁout (central panel), and Ėkin (bottom panel) of the molecular and ionized outflow in PDS 456 (star symbols) vs. Lbol. We compare these values with those of ionized and molecular outflows reported in F17, B19, Fluetsch et al. (2019), and Speranza et al. (2024). For the estimation of the ionized outflow properties, an ne of 200 cm−3 from F17 was used.
Current usage metrics show cumulative count of Article Views (full-text article views including HTML views, PDF and ePub downloads, according to the available data) and Abstracts Views on Vision4Press platform.
Data correspond to usage on the plateform after 2015. The current usage metrics is available 48-96 hours after online publication and is updated daily on week days.
Initial download of the metrics may take a while.