Fig. 11.
Download original image
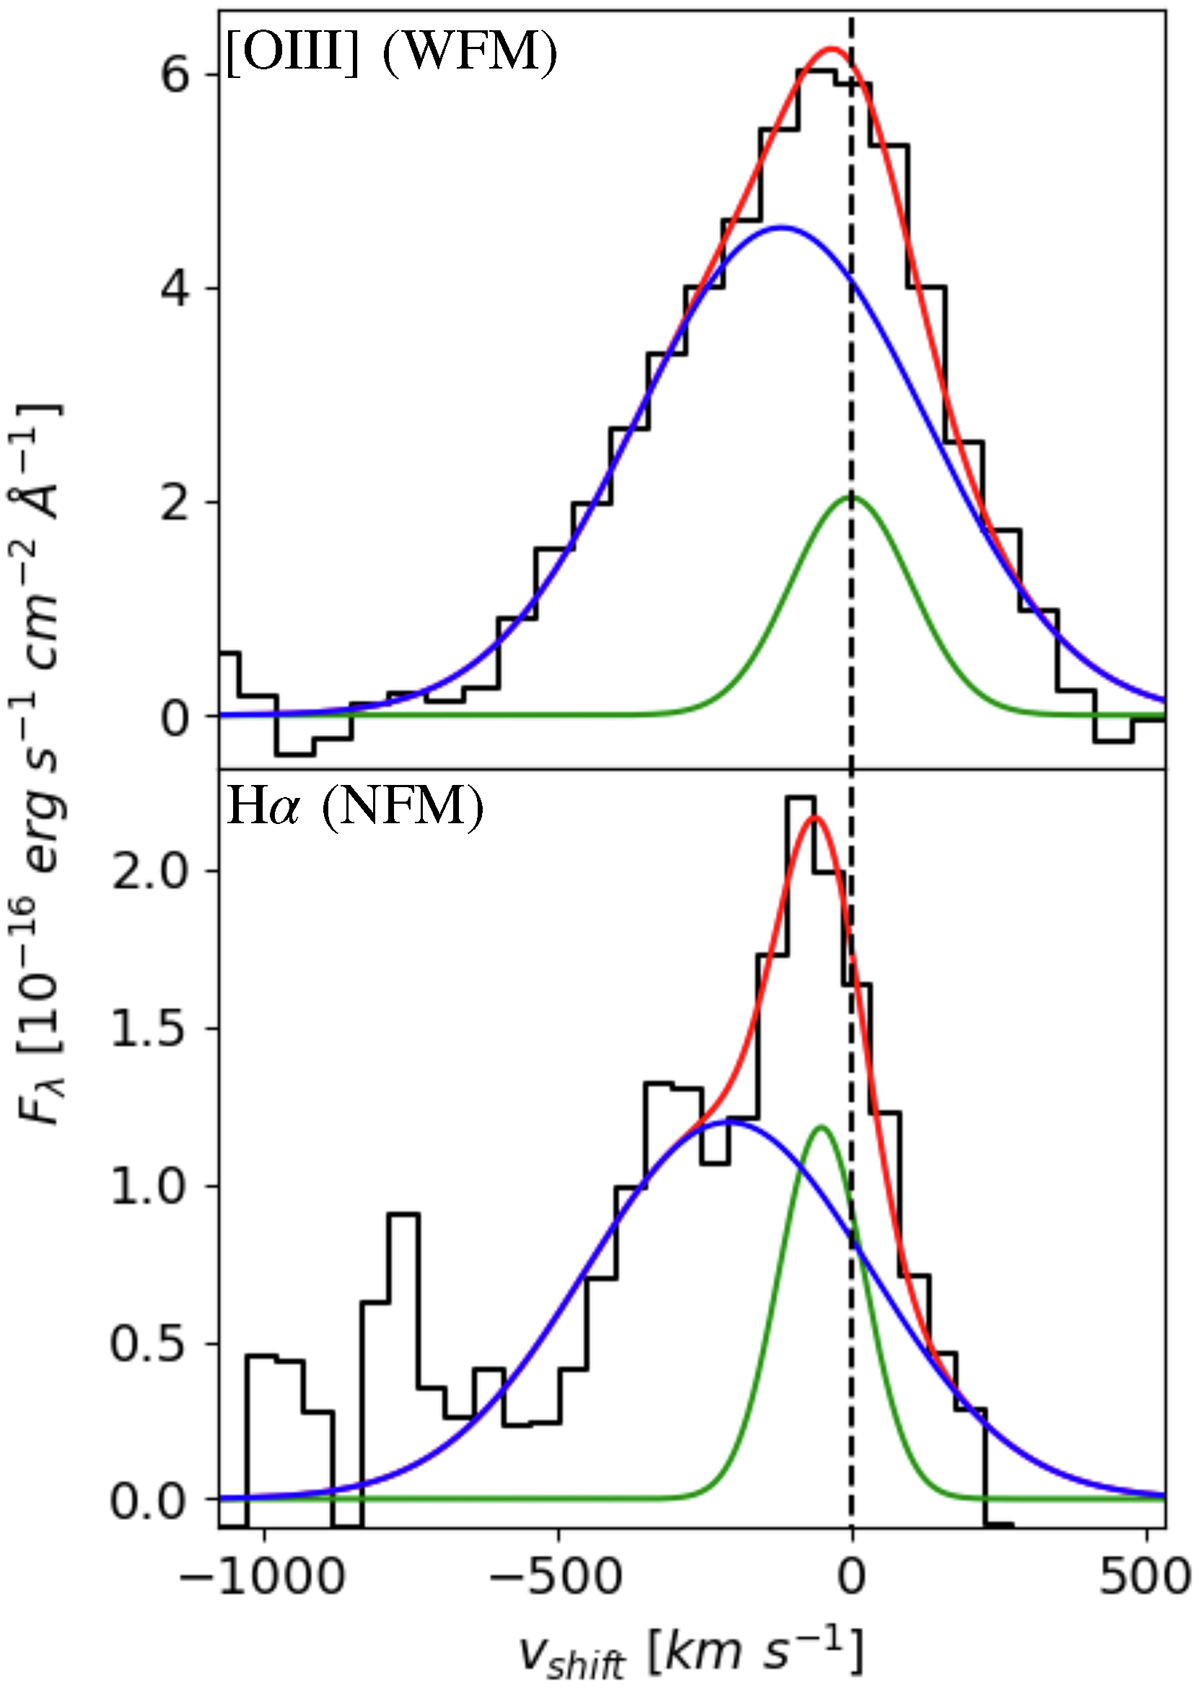
Spectra, in velocity units, extracted from the regions where the outflow dominates the emission (see text for details), in WFM (top panel) and NFM (bottom panel) MUSE data. Shown are a zoomed-in images of the [O III] (top panel) and Hα (bottom panel) transitions. The red lines show the best-fit model consisting of the combination of two Gaussian components: a narrow one (green) and a broader one (blue), tracing the outflow.
Current usage metrics show cumulative count of Article Views (full-text article views including HTML views, PDF and ePub downloads, according to the available data) and Abstracts Views on Vision4Press platform.
Data correspond to usage on the plateform after 2015. The current usage metrics is available 48-96 hours after online publication and is updated daily on week days.
Initial download of the metrics may take a while.