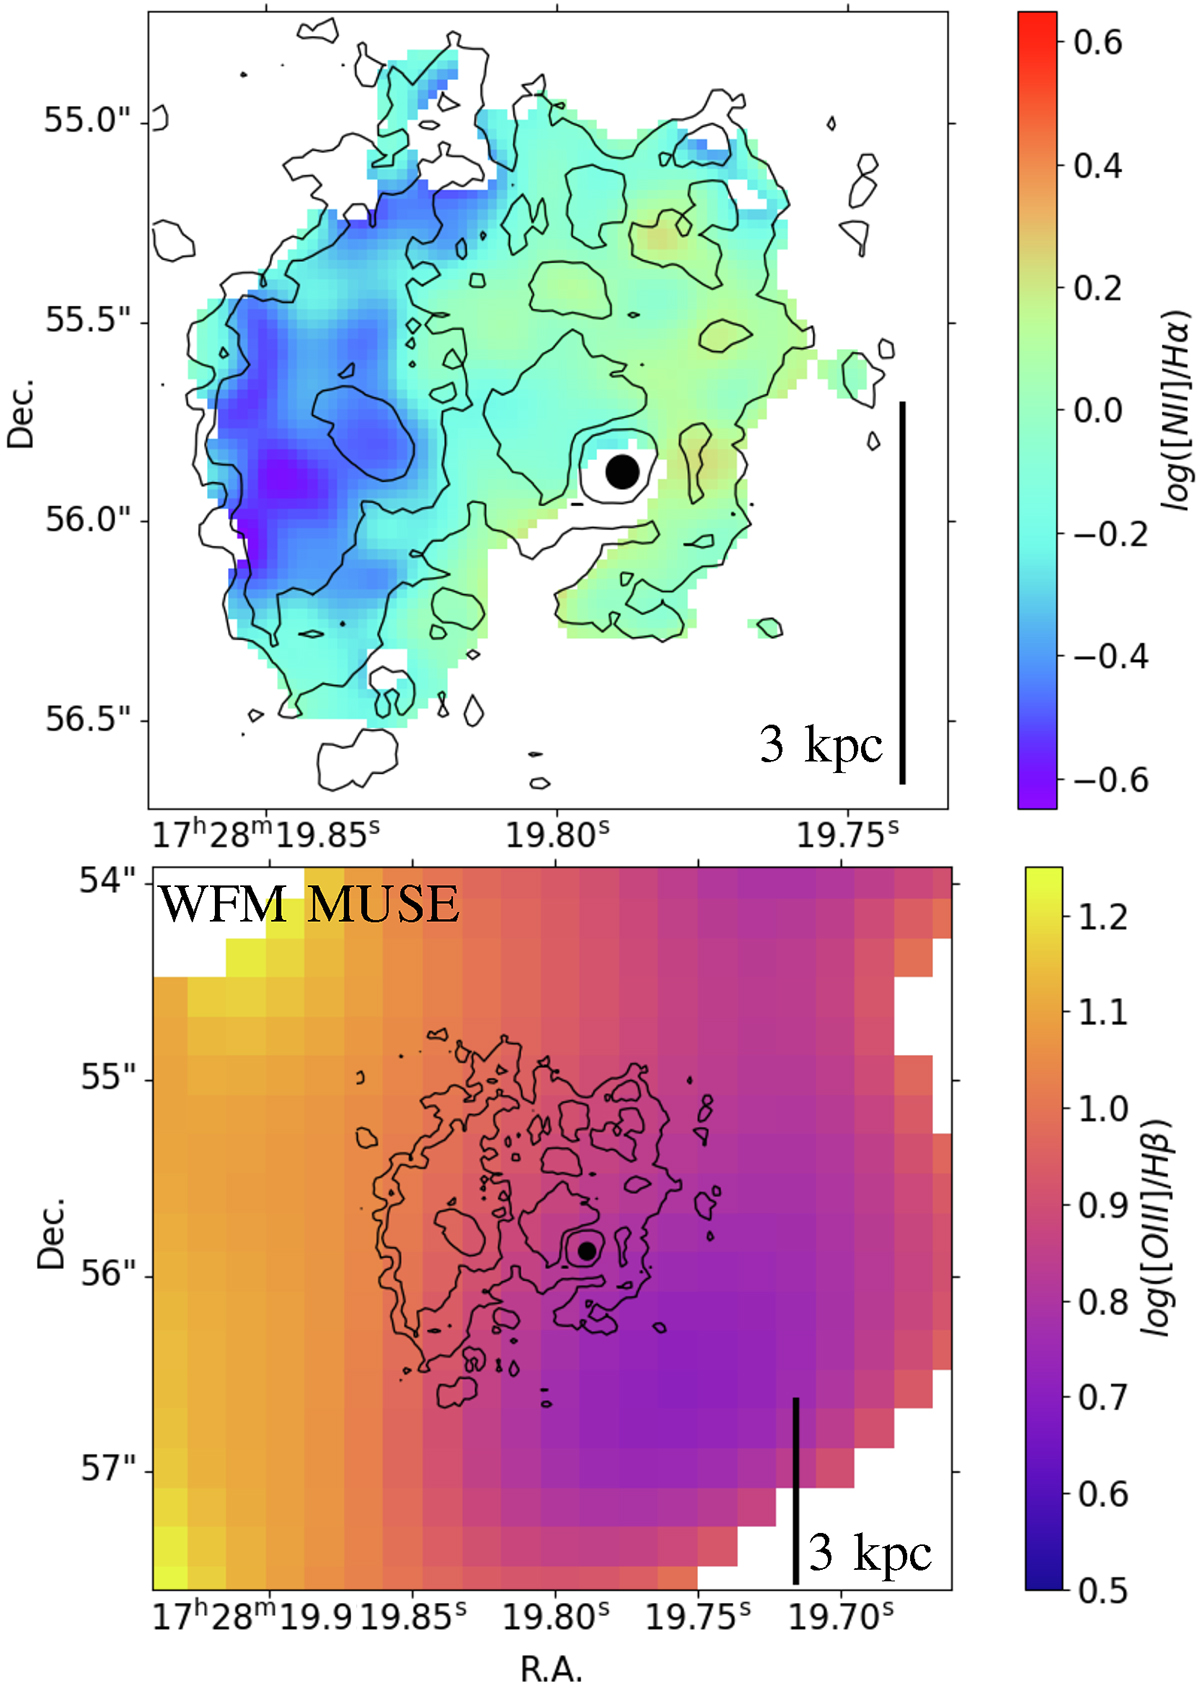
Fig. 10.
Download original image
Emission-line ratio maps for the extended gas around PDS 456. Top panel: [N II]/Hα emission line ratio map, at S/NHα > 2.5, whose pixel size is five times larger than the native pixel in NFM MUSE data, which corresponds to ∼1.3 FWHMPSF. The black dot gives the position of the central quasar, and has the FWHM size of the PSFNFM. Bottom panel: Map of the [O III]/Hβ line ratio estimated through the [O III] and Hβ optimally extracted NB images extracted from the WFM MUSE data with CubExtractor. The black contours represent the S/N levels of the Hα emission extracted from the NFM MUSE data at 3, 5, and 10.
Current usage metrics show cumulative count of Article Views (full-text article views including HTML views, PDF and ePub downloads, according to the available data) and Abstracts Views on Vision4Press platform.
Data correspond to usage on the plateform after 2015. The current usage metrics is available 48-96 hours after online publication and is updated daily on week days.
Initial download of the metrics may take a while.