Open Access
Fig. A.1.
Download original image
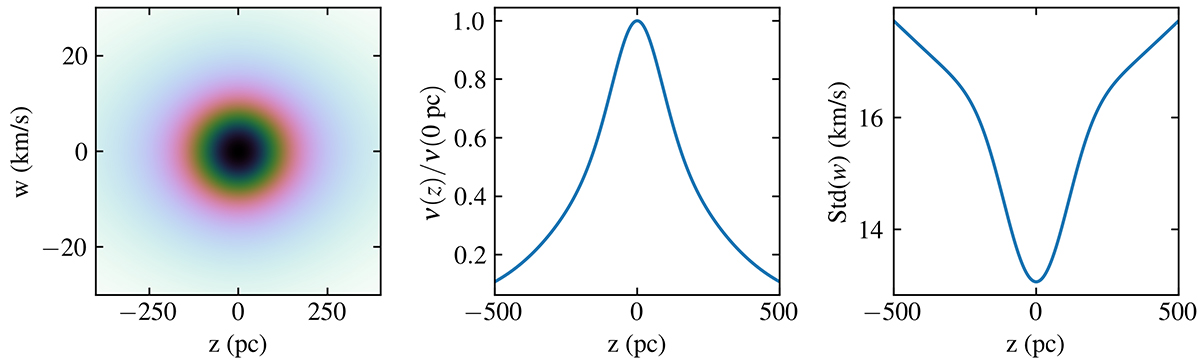
Phase-space distribution of our non-perturbed, steady-state model. The left panel shows a 2D histogram in the (z, w) phase-space plane. The middle panel shows the stellar number density profile, normalised to unity in the mid-plane. The right panel shows the standard deviation of vertical velocity, as a function of height.
Current usage metrics show cumulative count of Article Views (full-text article views including HTML views, PDF and ePub downloads, according to the available data) and Abstracts Views on Vision4Press platform.
Data correspond to usage on the plateform after 2015. The current usage metrics is available 48-96 hours after online publication and is updated daily on week days.
Initial download of the metrics may take a while.