Fig. 5.
Download original image
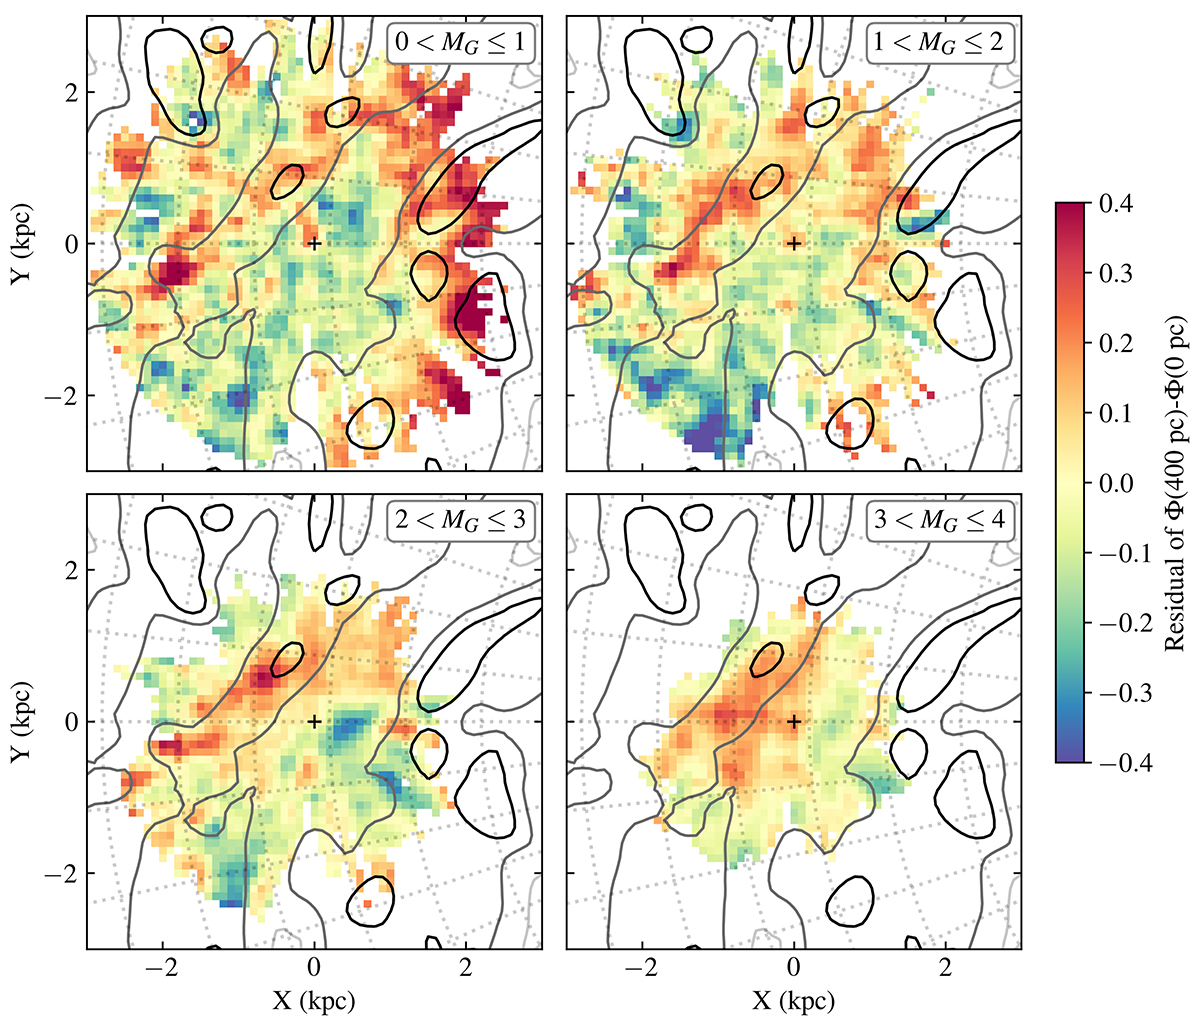
Residual of Φ(400 pc)−Φ(0 pc) with respect to a fitted exponential, projected on the (X, Y) plane. Each panel corresponds to one of our four data samples. In each panel, dotted grey lines show galactocentric iso-radial and iso-azimuthal lines, and the black plus sign in the centre marks the solar position. The grey contour lines correspond to the spiral arms as mapped by Poggio et al. (2021), as seen in Fig. 6.
Current usage metrics show cumulative count of Article Views (full-text article views including HTML views, PDF and ePub downloads, according to the available data) and Abstracts Views on Vision4Press platform.
Data correspond to usage on the plateform after 2015. The current usage metrics is available 48-96 hours after online publication and is updated daily on week days.
Initial download of the metrics may take a while.