Fig. 4.
Download original image
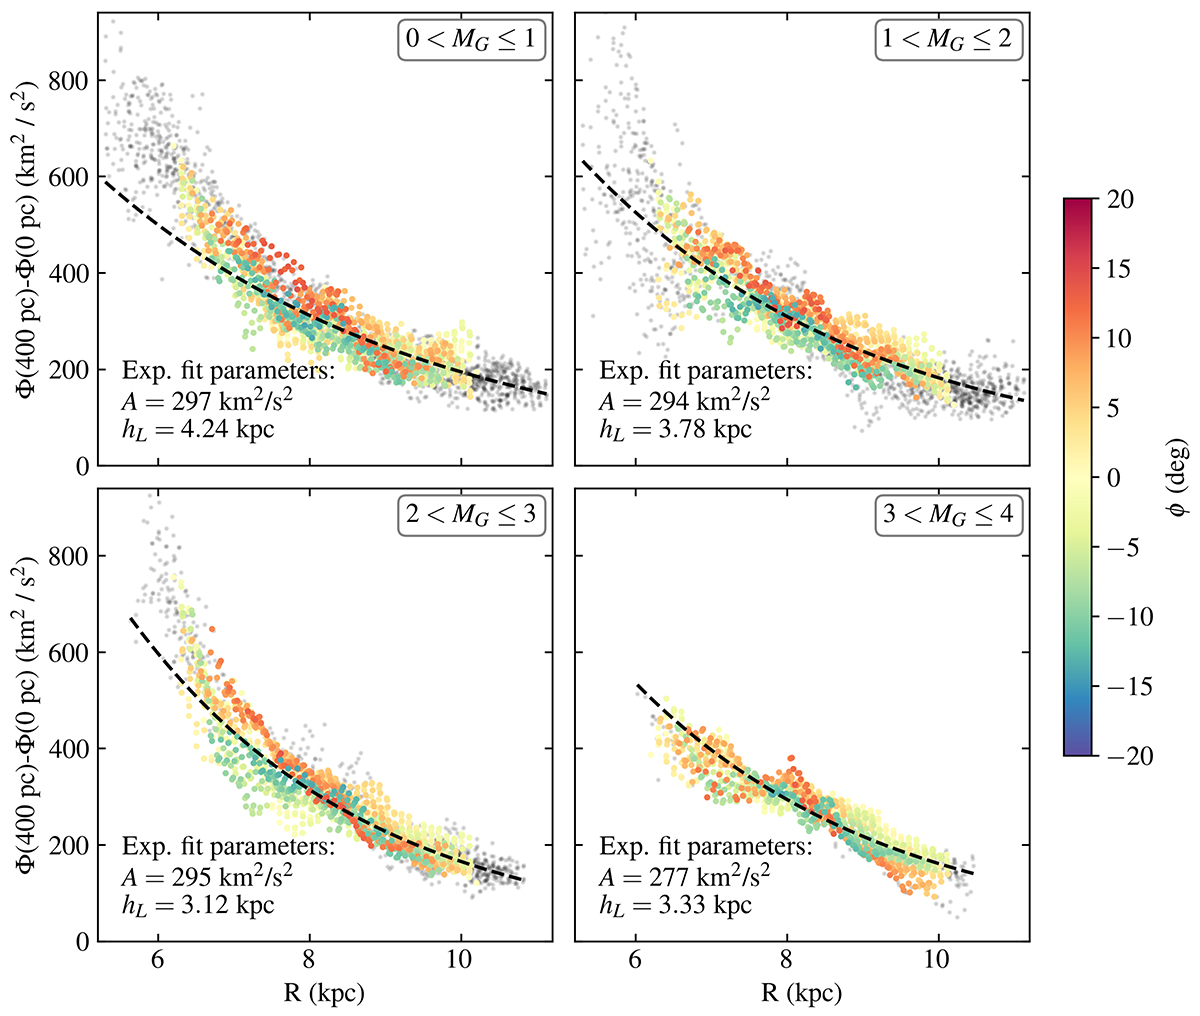
Gravitational potential, Φ(400 pc)−Φ(0 pc), as a function of galactocentric radius, for the four stellar samples (as labelled in the panels’ top-right corner). The dashed line is the exponential function of Eq. (9) fitted to data points with ![]() , which excludes distant and dubious spatial regions. The scatter points correspond to area cells in the (X, Y) plane. Area cells that are included in the exponential function fit are coloured according to their galactocentric disk plane angle (ϕ); excluded data cells have light grey and smaller scatter points. The colour bar and axis ranges are shared between all panels.
, which excludes distant and dubious spatial regions. The scatter points correspond to area cells in the (X, Y) plane. Area cells that are included in the exponential function fit are coloured according to their galactocentric disk plane angle (ϕ); excluded data cells have light grey and smaller scatter points. The colour bar and axis ranges are shared between all panels.
Current usage metrics show cumulative count of Article Views (full-text article views including HTML views, PDF and ePub downloads, according to the available data) and Abstracts Views on Vision4Press platform.
Data correspond to usage on the plateform after 2015. The current usage metrics is available 48-96 hours after online publication and is updated daily on week days.
Initial download of the metrics may take a while.