Fig. A.3.
Download original image
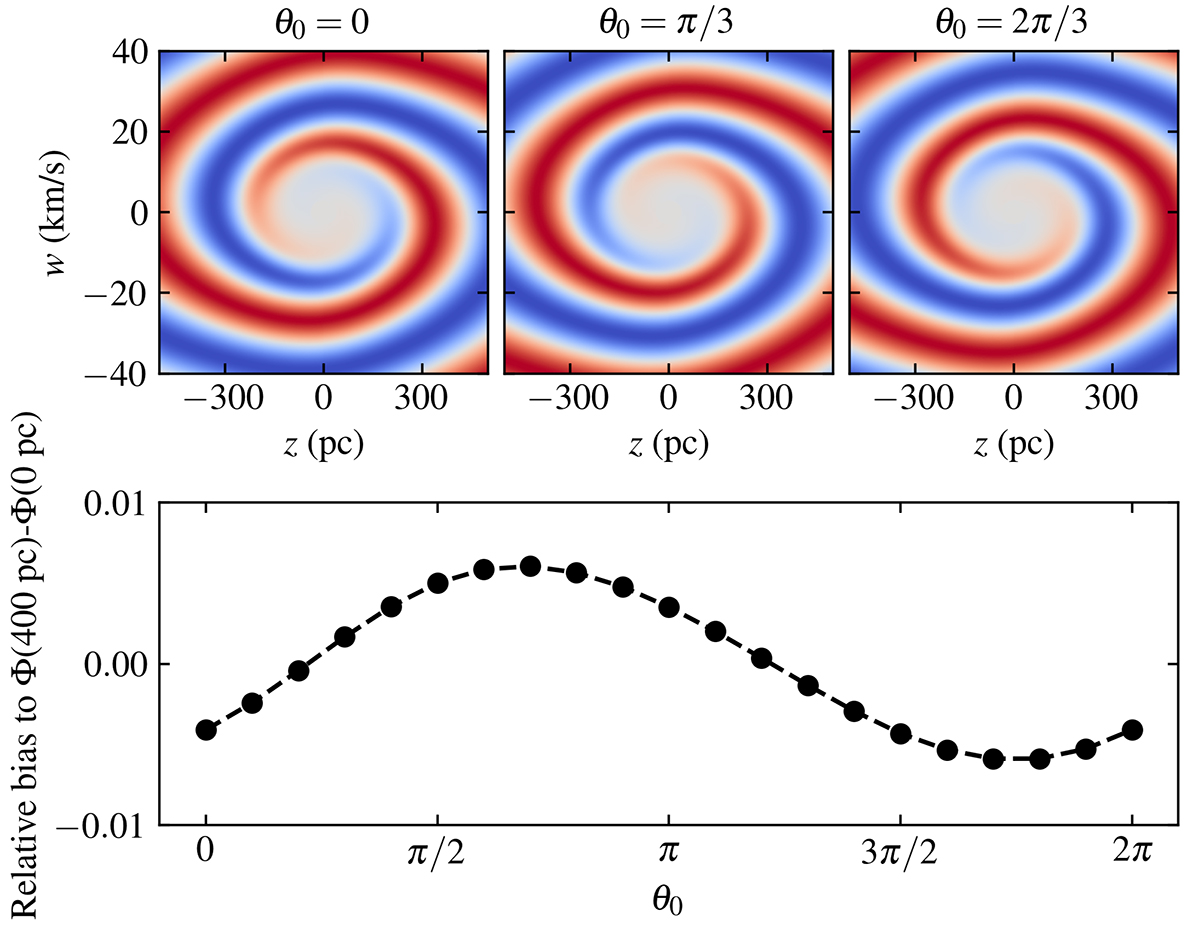
Relative bias for the inferred value of Φ(400 pc)−Φ(0 pc) using Jeans analysis under the assumption of equilibrium and in the presence of a phase-space spiral as a function of θ0. The top panels show the relative perturbation of the spiral (unlike Fig. A.2, which showed the total number densities), where red (blue) correspond to a over-density (under-density), whose relative amplitude is in the range [ − 20, 20]%.
Current usage metrics show cumulative count of Article Views (full-text article views including HTML views, PDF and ePub downloads, according to the available data) and Abstracts Views on Vision4Press platform.
Data correspond to usage on the plateform after 2015. The current usage metrics is available 48-96 hours after online publication and is updated daily on week days.
Initial download of the metrics may take a while.