Fig. 1.
Download original image
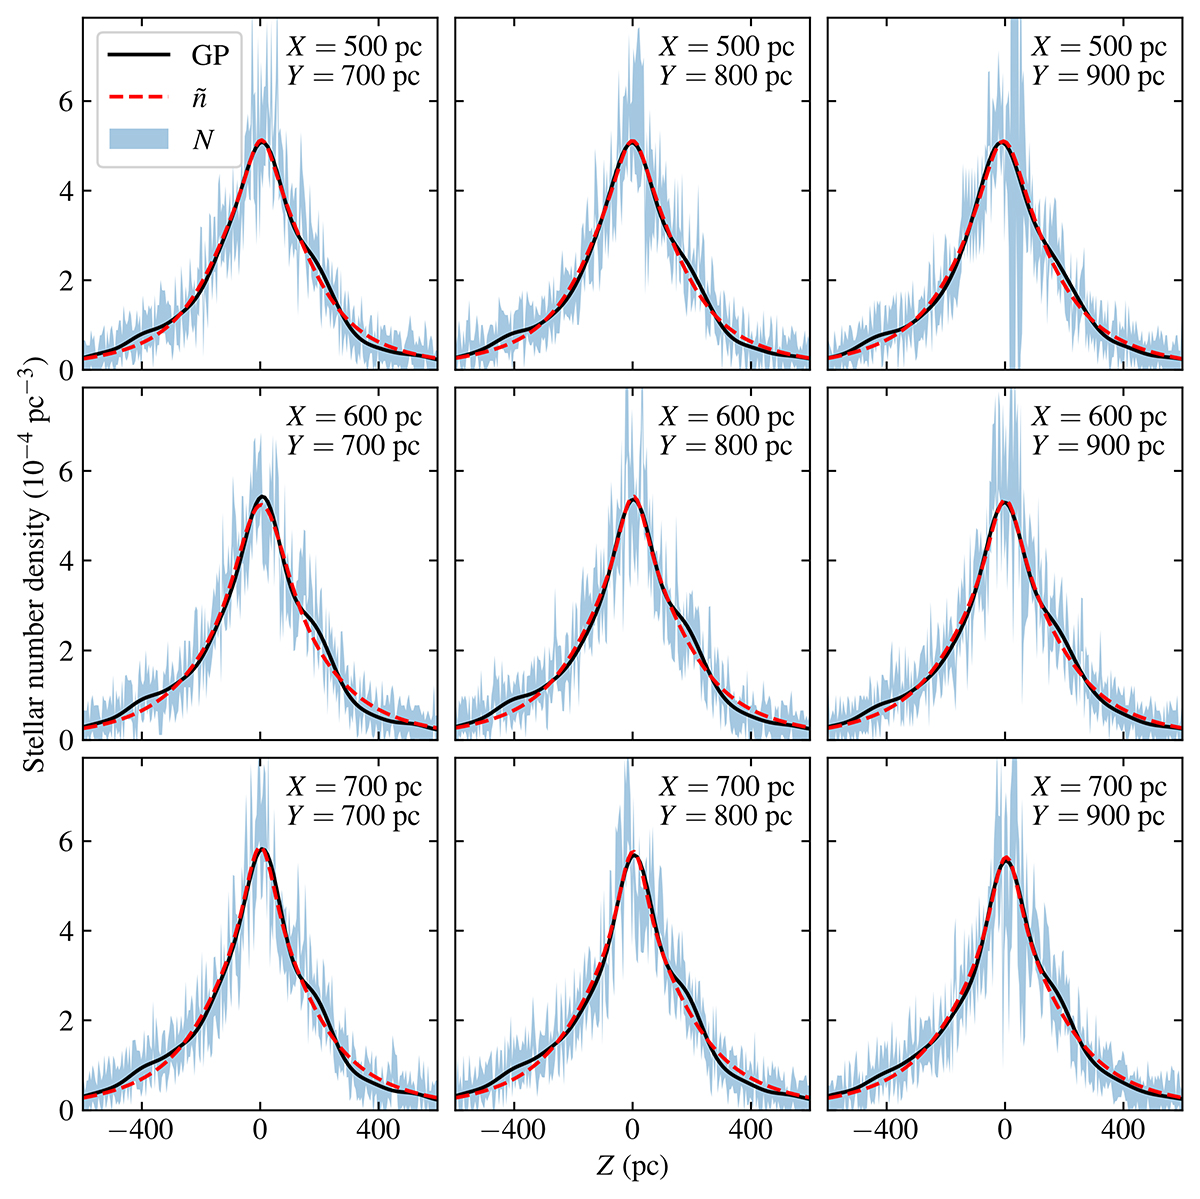
Stellar number density distribution for a few area cells of the data sample with 2 < MG ≤ 3. Each panel is labelled by the area cell’s mid-point (X, Y) coordinates. The function obtained by GP regression is shown in solid black; the fitted symmetric function (![]() ) of Eq. (5) is shown in dashed red; the raw number count (N) with its associated Poisson noise uncertainty is shown as a 1σ band.
) of Eq. (5) is shown in dashed red; the raw number count (N) with its associated Poisson noise uncertainty is shown as a 1σ band.
Current usage metrics show cumulative count of Article Views (full-text article views including HTML views, PDF and ePub downloads, according to the available data) and Abstracts Views on Vision4Press platform.
Data correspond to usage on the plateform after 2015. The current usage metrics is available 48-96 hours after online publication and is updated daily on week days.
Initial download of the metrics may take a while.