Fig. 13
Download original image
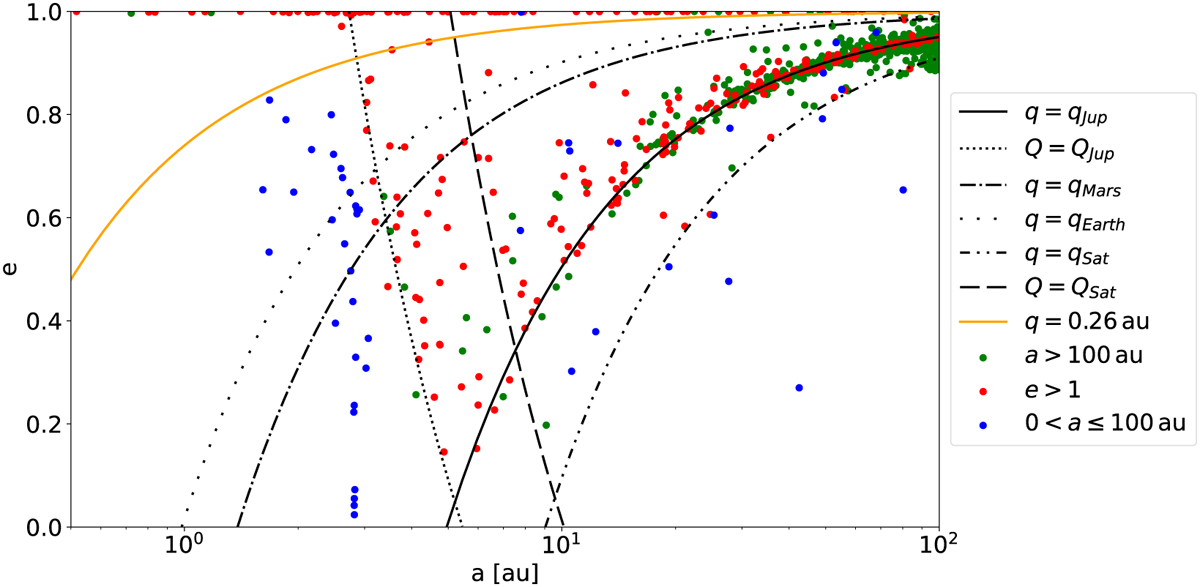
Final distribution of 1000 test particles that were selected by Todorović (2017) and integrated by MERCURIUS integrator for 5 Myr. Green and red dots represent the positions from which the particles were ejected to hyperbolic orbits (red dots) and orbits with a > 100 au (green dots), whereas particles that survive the whole simulation for 5 Myr are blue. Black lines represent the perihelion and aphelion distances of selected planets. The orange line represents the perihelion distance, q = 0.26 au.
Current usage metrics show cumulative count of Article Views (full-text article views including HTML views, PDF and ePub downloads, according to the available data) and Abstracts Views on Vision4Press platform.
Data correspond to usage on the plateform after 2015. The current usage metrics is available 48-96 hours after online publication and is updated daily on week days.
Initial download of the metrics may take a while.