Open Access
Fig. 7
Download original image
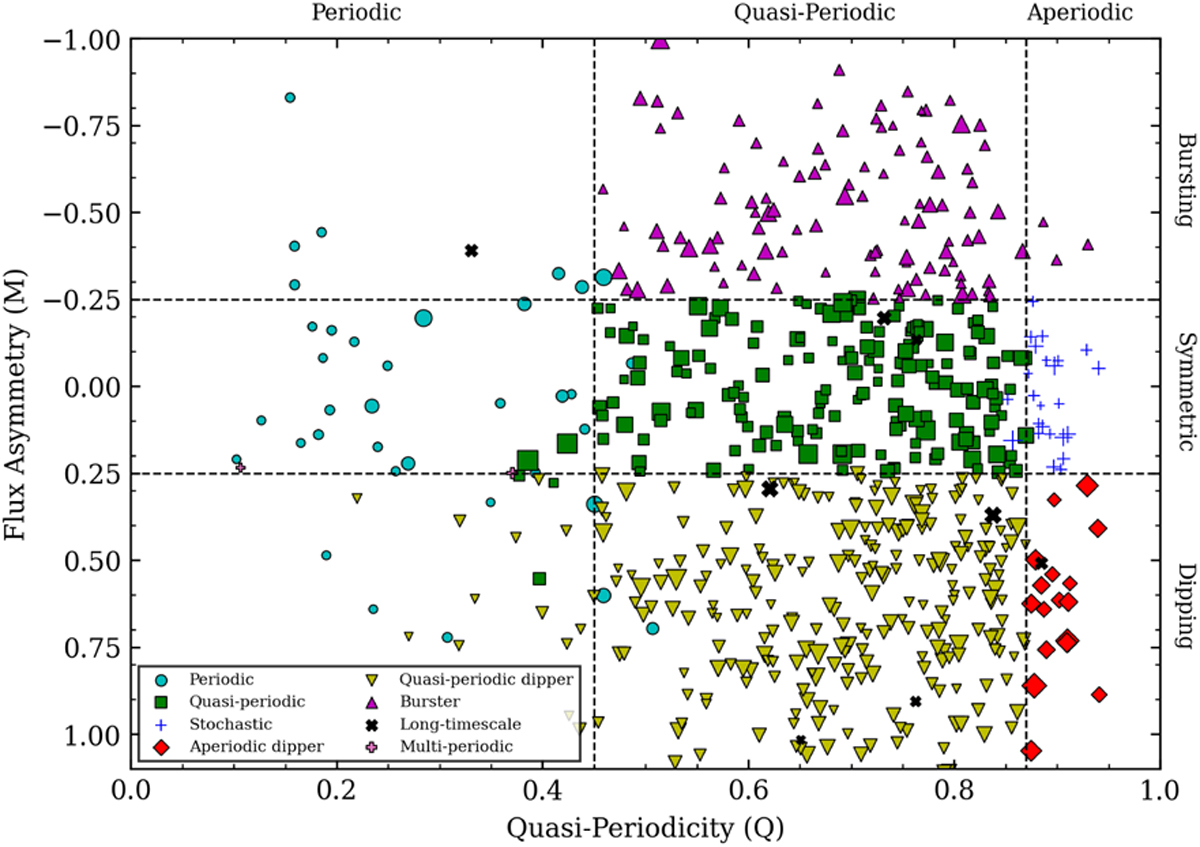
Flux asymmetry vs quasi-periodicity of variables in our sample on the Q–M plot, with different colours for each light curve type. The point size shows the peak-to-peak variability metric, ν, scaled linearly. The Q–M classification is mostly accurate, with only a few sources needing manual adjustment.
Current usage metrics show cumulative count of Article Views (full-text article views including HTML views, PDF and ePub downloads, according to the available data) and Abstracts Views on Vision4Press platform.
Data correspond to usage on the plateform after 2015. The current usage metrics is available 48-96 hours after online publication and is updated daily on week days.
Initial download of the metrics may take a while.